You are the manager of a restaurant for a fast-food franchise. Last month, the mean waiting time at the drive-through window for branches in your geographical region, as measured from the time a customer places an order until the time the customer receives the order, was 3.7 minutes. You select a random sample of 64 orders. The sample mean waiting time is 3.94 minutes, with a sample standard deviation of 0.8 minute. Complete parts (a) and (b) below. a. At the 0.10 level of significance, is there evidence that the population mean waiting time is different from 3.7 minutes? State the null and alternative hypotheses. Ho:H =3.7 H,:µ =3.7 (Type integers or decimals.) Determine the test statistic. The test statistic is 2.40'. (Round to two decimal places as needed.) Find the p-value. p-value = 0.019 (Round to three decimal places as needed.) State the conclusion.
You are the manager of a restaurant for a fast-food franchise. Last month, the mean waiting time at the drive-through window for branches in your geographical region, as measured from the time a customer places an order until the time the customer receives the order, was 3.7 minutes. You select a random sample of 64 orders. The sample mean waiting time is 3.94 minutes, with a sample standard deviation of 0.8 minute. Complete parts (a) and (b) below. a. At the 0.10 level of significance, is there evidence that the population mean waiting time is different from 3.7 minutes? State the null and alternative hypotheses. Ho:H =3.7 H,:µ =3.7 (Type integers or decimals.) Determine the test statistic. The test statistic is 2.40'. (Round to two decimal places as needed.) Find the p-value. p-value = 0.019 (Round to three decimal places as needed.) State the conclusion.

MATLAB: An Introduction with Applications
6th Edition
ISBN:9781119256830
Author:Amos Gilat
Publisher:Amos Gilat
Chapter1: Starting With Matlab
Section: Chapter Questions
Problem 1P

Related questions

Question
Those are the correct answers but I need to know only how to find out the p-value which is 0.019 and it is the correct answer.
Can you please break down the steps I just need to learn about the p-value....forget aboout the other questions.
Note: if you come out with a diferent answer as sometimes bartleby does please do not submit it to me.
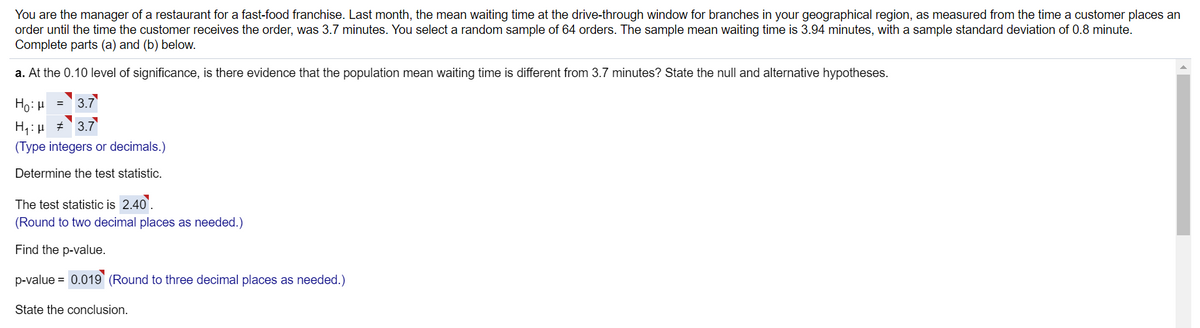
Transcribed Image Text:You are the manager of a restaurant for a fast-food franchise. Last month, the mean waiting time at the drive-through window for branches in your geographical region, as measured from the time a customer places an
order until the time the customer receives the order, was 3.7 minutes. You select a random sample of 64 orders. The sample mean waiting time is 3.94 minutes, with a sample standard deviation of 0.8 minute.
Complete parts (a) and (b) below.
a. At the 0.10 level of significance, is there evidence that the population mean waiting time is different from 3.7 minutes? State the null and alternative hypotheses.
3.7
= r1:0H
H1:µ # 3.7
(Type integers or decimals.)
Determine the test statistic.
The test statistic is 2.40'.
(Round to two decimal places as needed.)
Find the p-value.
p-value = 0.019` (Round to three decimal places as needed.)
State the conclusion.
Expert Solution
This question has been solved!
Explore an expertly crafted, step-by-step solution for a thorough understanding of key concepts.

This is a popular solution!

Trending now
This is a popular solution!

Step by step
Solved in 2 steps with 1 images

Knowledge Booster


Learn more about
Need a deep-dive on the concept behind this application? Look no further. Learn more about this topic, statistics and related others by exploring similar questions and additional content below.Recommended textbooks for you
MATLAB: An Introduction with Applications
Statistics
ISBN:
9781119256830
Author:
Amos Gilat
Publisher:
John Wiley & Sons Inc

Probability and Statistics for Engineering and th…
Statistics
ISBN:
9781305251809
Author:
Jay L. Devore
Publisher:
Cengage Learning

Statistics for The Behavioral Sciences (MindTap C…
Statistics
ISBN:
9781305504912
Author:
Frederick J Gravetter, Larry B. Wallnau
Publisher:
Cengage Learning
MATLAB: An Introduction with Applications
Statistics
ISBN:
9781119256830
Author:
Amos Gilat
Publisher:
John Wiley & Sons Inc
Probability and Statistics for Engineering and th…
Statistics
ISBN:
9781305251809
Author:
Jay L. Devore
Publisher:
Cengage Learning
Statistics for The Behavioral Sciences (MindTap C…
Statistics
ISBN:
9781305504912
Author:
Frederick J Gravetter, Larry B. Wallnau
Publisher:
Cengage Learning

Elementary Statistics: Picturing the World (7th E…
Statistics
ISBN:
9780134683416
Author:
Ron Larson, Betsy Farber
Publisher:
PEARSON

The Basic Practice of Statistics
Statistics
ISBN:
9781319042578
Author:
David S. Moore, William I. Notz, Michael A. Fligner
Publisher:
W. H. Freeman

Introduction to the Practice of Statistics
Statistics
ISBN:
9781319013387
Author:
David S. Moore, George P. McCabe, Bruce A. Craig
Publisher:
W. H. Freeman