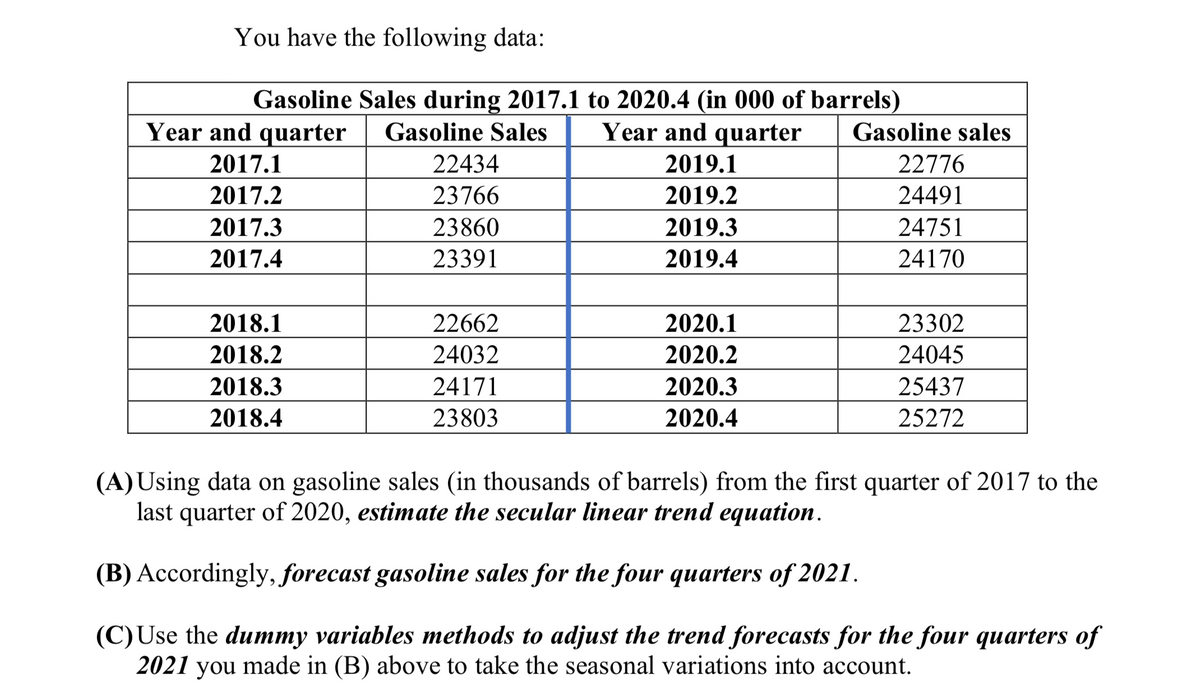
You have the following data: Gasoline Sales during 2017.1 to 2020.4 (in 000 of barrels) Year and quarter Gasoline Sales Year and quarter Gasoline sales 2017.1 22434 2019.1 22776 2017.2 23766 2019.2 24491 2017.3 23860 2019.3 24751 2017.4 23391 2019.4 24170 2018.1 22662 2020.1 23302 2018.2 24032 2020.2 24045 2018.3 24171 2020.3 25437 2018.4 23803 2020.4 25272 (A)Using data on gasoline sales (in thousands of barrels) from the first quarter of 2017 to the last quarter of 2020, estimate the secular linear trend equation. (B) Accordingly, forecast gasoline sales for the four quarters of 2021. (C)Use the dummy variables methods to adjust the trend forecasts for the four quarters of 2021 you made in (B) above to take the seasonal variations into account.


Inverse Normal Distribution
The method used for finding the corresponding z-critical value in a normal distribution using the known probability is said to be an inverse normal distribution. The inverse normal distribution is a continuous probability distribution with a family of two parameters.
Mean, Median, Mode
It is a descriptive summary of a data set. It can be defined by using some of the measures. The central tendencies do not provide information regarding individual data from the dataset. However, they give a summary of the data set. The central tendency or measure of central tendency is a central or typical value for a probability distribution.
Z-Scores
A z-score is a unit of measurement used in statistics to describe the position of a raw score in terms of its distance from the mean, measured with reference to standard deviation from the mean. Z-scores are useful in statistics because they allow comparison between two scores that belong to different normal distributions.


Trending now
This is a popular solution!

Step by step
Solved in 4 steps with 6 images


