A data set lists earthquake depths. The summary statistics are n=400, x=4.87 km, s=4.61 km. Use a 0.01 significance level to test the claim of a seismologist that these earthquakes are from a population with a mean equal to 4.00. Assume that a simple random sample has been selected. Identify the null and alternative hypotheses, test statistic, P-value, and state the final conclusion that addresses the original claim. Determine the test statistic. (Round to two decimal places as needed.) Determine the P-value. (Round to three decimal places as needed.) State the final conclusion that addresses the original claim. Fail to reject Ho. There is not sufficient evidence to conclude that the mean of the population of earthquake depths is 4.00 km is not correct.
A data set lists earthquake depths. The summary statistics are n=400, x=4.87 km, s=4.61 km. Use a 0.01 significance level to test the claim of a seismologist that these earthquakes are from a population with a mean equal to 4.00. Assume that a simple random sample has been selected. Identify the null and alternative hypotheses, test statistic, P-value, and state the final conclusion that addresses the original claim. Determine the test statistic. (Round to two decimal places as needed.) Determine the P-value. (Round to three decimal places as needed.) State the final conclusion that addresses the original claim. Fail to reject Ho. There is not sufficient evidence to conclude that the mean of the population of earthquake depths is 4.00 km is not correct.

MATLAB: An Introduction with Applications
6th Edition
ISBN:9781119256830
Author:Amos Gilat
Publisher:Amos Gilat
Chapter1: Starting With Matlab
Section: Chapter Questions
Problem 1P

Related questions
Question
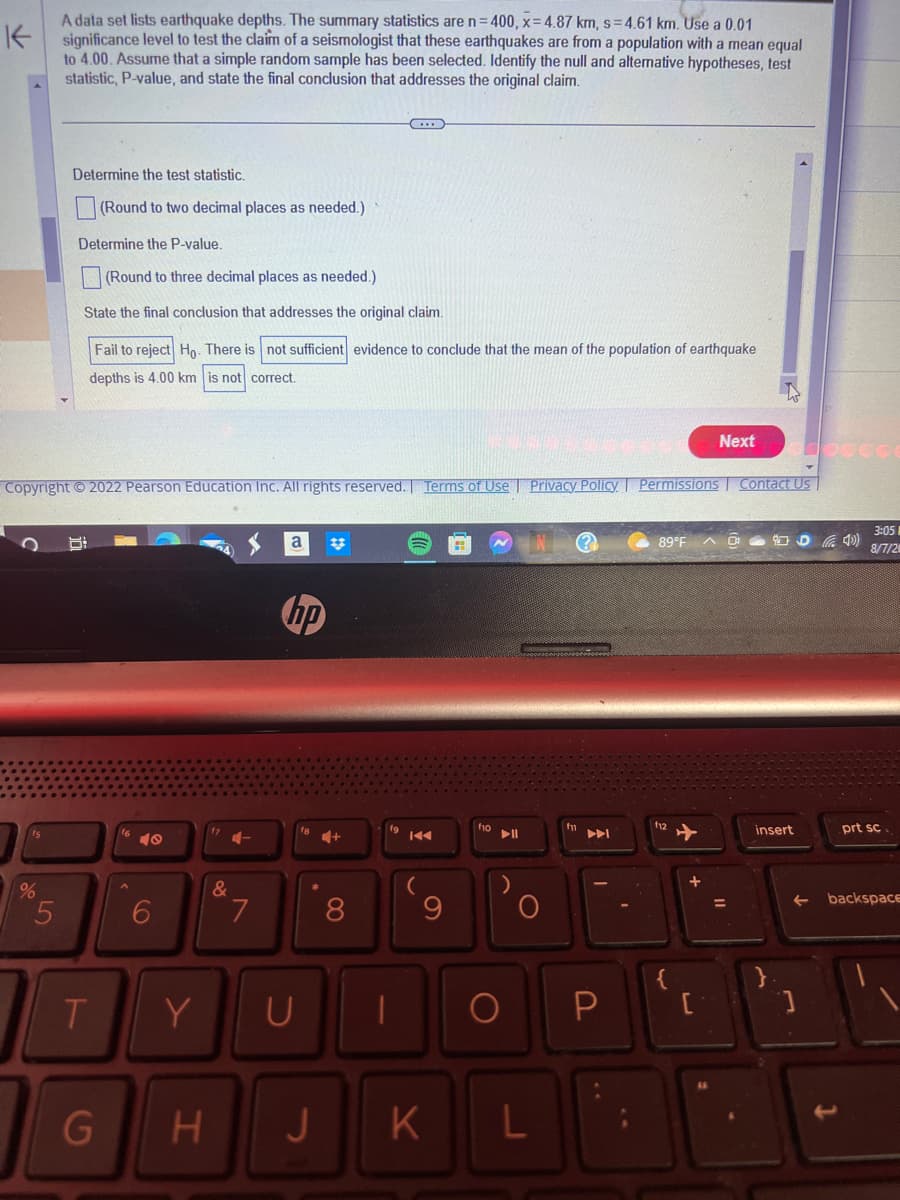
Transcribed Image Text:A data set lists earthquake depths. The summary statistics are n=400, x=4.87 km, s=4.61 km. Use a 0.01
Ksignificance level to test the claim of a seismologist that these earthquakes are from a population with a mean equal
to 4.00. Assume that a simple random sample has been selected. Identify the null and alternative hypotheses, test
statistic, P-value, and state the final conclusion that addresses the original claim.
%
Determine the test statistic.
(Round to two decimal places as needed.)
Determine the P-value.
(Round to three decimal places as needed.)
State the final conclusion that addresses the original claim.
Fail to reject Ho. There is not sufficient evidence to conclude that the mean of the population of earthquake
depths is 4.00 km is not correct.
Copyright © 2022 Pearson Education Inc. All rights reserved. Terms of Use | Privacy Policy. Permissions
5
T
G
6
Y
H
f7
&
7
a
hp
U
10
8
J
(
9
K
H
f10
O
L
f11
P
89°F
112
{
Next
[
Contact Us
insert
}
400)
3:05
8/7/20
prt sc
← backspace
![K
A data set lists earthquake depths. The summary statistics are n=400, x=4.87 km, s=4.61 km. Use a 0.01
significance level to test the claim of a seismologist that these earthquakes are from a population with a mean equal
to 4.00. Assume that a simple random sample has been selected. Identify the null and alternative hypotheses, test
statistic, P-value, and state the final conclusion that addresses the original claim.
fs
%
What are the null and alternative hypotheses?
OA. Ho: H=4.00 km
H₁: <4.00 km
V
OC. Ho: p=4.00 km
H₁: #4.00 km
B
Determine the test statistic.
(Round to two decimal places as needed.).
Determine the P-value
Copyright © 2022 Pearson Education Inc. All rights reserved. Terms of Use Privacy Policy Permissions Contact Us
T
G
40
6
Y
&
7
a
hp
B N
8
U |
J
H
OB. Ho: #4.00 km
H₁: μ=4.00 km
M
O D. Ho: H=4.00 km
H₁: μ>4.00 km
(
K
O
N
L
?
P
89°FDA)
12
{
Next
+
[
=
insert
]
3:04 PM
8/7/2022
pause
prt sc
backspace
del-](/v2/_next/image?url=https%3A%2F%2Fcontent.bartleby.com%2Fqna-images%2Fquestion%2F0cd219d1-d42d-45c9-9eda-41ccbbe4a028%2F84c410c7-c744-44a1-8f12-af3812d091b8%2F8i8bc1_processed.jpeg&w=3840&q=75)
Transcribed Image Text:K
A data set lists earthquake depths. The summary statistics are n=400, x=4.87 km, s=4.61 km. Use a 0.01
significance level to test the claim of a seismologist that these earthquakes are from a population with a mean equal
to 4.00. Assume that a simple random sample has been selected. Identify the null and alternative hypotheses, test
statistic, P-value, and state the final conclusion that addresses the original claim.
fs
%
What are the null and alternative hypotheses?
OA. Ho: H=4.00 km
H₁: <4.00 km
V
OC. Ho: p=4.00 km
H₁: #4.00 km
B
Determine the test statistic.
(Round to two decimal places as needed.).
Determine the P-value
Copyright © 2022 Pearson Education Inc. All rights reserved. Terms of Use Privacy Policy Permissions Contact Us
T
G
40
6
Y
&
7
a
hp
B N
8
U |
J
H
OB. Ho: #4.00 km
H₁: μ=4.00 km
M
O D. Ho: H=4.00 km
H₁: μ>4.00 km
(
K
O
N
L
?
P
89°FDA)
12
{
Next
+
[
=
insert
]
3:04 PM
8/7/2022
pause
prt sc
backspace
del-
Expert Solution
This question has been solved!
Explore an expertly crafted, step-by-step solution for a thorough understanding of key concepts.

Step by step
Solved in 3 steps with 2 images

Recommended textbooks for you
MATLAB: An Introduction with Applications
Statistics
ISBN:
9781119256830
Author:
Amos Gilat
Publisher:
John Wiley & Sons Inc

Probability and Statistics for Engineering and th…
Statistics
ISBN:
9781305251809
Author:
Jay L. Devore
Publisher:
Cengage Learning

Statistics for The Behavioral Sciences (MindTap C…
Statistics
ISBN:
9781305504912
Author:
Frederick J Gravetter, Larry B. Wallnau
Publisher:
Cengage Learning
MATLAB: An Introduction with Applications
Statistics
ISBN:
9781119256830
Author:
Amos Gilat
Publisher:
John Wiley & Sons Inc
Probability and Statistics for Engineering and th…
Statistics
ISBN:
9781305251809
Author:
Jay L. Devore
Publisher:
Cengage Learning
Statistics for The Behavioral Sciences (MindTap C…
Statistics
ISBN:
9781305504912
Author:
Frederick J Gravetter, Larry B. Wallnau
Publisher:
Cengage Learning

Elementary Statistics: Picturing the World (7th E…
Statistics
ISBN:
9780134683416
Author:
Ron Larson, Betsy Farber
Publisher:
PEARSON

The Basic Practice of Statistics
Statistics
ISBN:
9781319042578
Author:
David S. Moore, William I. Notz, Michael A. Fligner
Publisher:
W. H. Freeman

Introduction to the Practice of Statistics
Statistics
ISBN:
9781319013387
Author:
David S. Moore, George P. McCabe, Bruce A. Craig
Publisher:
W. H. Freeman