You must install the jpower module in Jamovi. To install this module, click the + Modules button in the upper right corner then select jamovi library. Scroll through the module options until you see jpower and click install. Once installed, click the jpower module and select the Independent Sample T-Test option. I. For power = 0.55, required n =
You must install the jpower module in Jamovi. To install this module, click the + Modules button in the upper right corner then select jamovi library. Scroll through the module options until you see jpower and click install. Once installed, click the jpower module and select the Independent Sample T-Test option. I. For power = 0.55, required n =

MATLAB: An Introduction with Applications
6th Edition
ISBN:9781119256830
Author:Amos Gilat
Publisher:Amos Gilat
Chapter1: Starting With Matlab
Section: Chapter Questions
Problem 1P

Related questions
Question
Suppose a study is being planned that will investigate whether female Beagles with severe periodontitis (gum and mouth disease) give birth to smaller litters of puppies, on average, than Beagles without periodontitis. Based on previous research, the standard deviation of litter size is estimated to be 2.1 puppies.
Suppose we suspect that Beagles with periodontitis will give birth to on average 6 puppies whereas Beagles without periodontitis will give birth to on average 5 puppies.
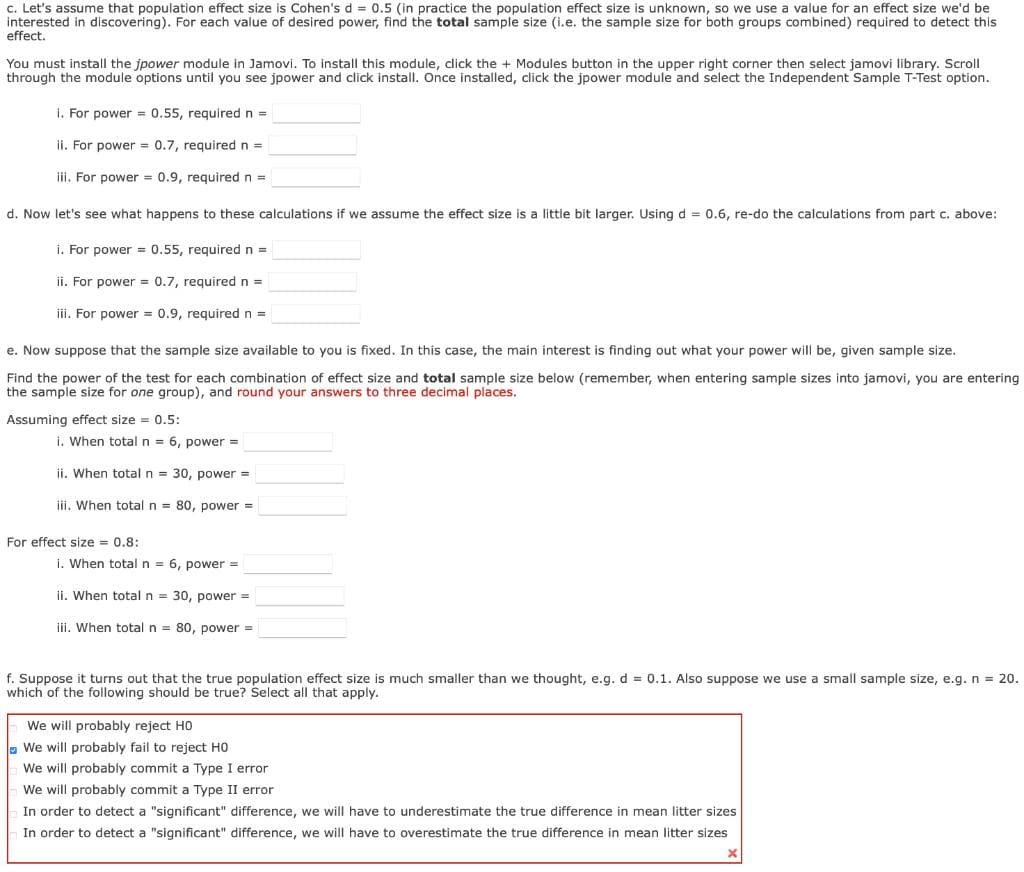
Transcribed Image Text:c. Let's assume that population effect size is Cohen's d = 0.5 (in practice the population effect size is unknown, so we use a value for an effect size we'd be
interested in discovering). For each value of desired power, find the total sample size (i.e. the sample size for both groups combined) required to detect this
effect.
You must instail the jpower module in Jamovi. To install this module, click the + Modules button in the upper right corner then select jamovi library. Scroll
through the module options until you see jpower and click install. Once installed, click the jpower module and select the Independent Sample T-Test option.
i. For power = 0.55, required n =
ii. For power = 0.7, required n =
iii. For power = 0.9, required n =
d. Now let's see what happens to these calculations if we assume the effect size is a little bit larger. Using d = 0.6, re-do the calculations from part c. above:
i. For power = 0.55, required n =
ii. For power = 0.7, required n =
iii. For power = 0.9, required n =
e. Now suppose that the sample size available to you is fixed. In this case, the main interest is finding out what your power will be, given sample size.
Find the power of the test for each combination of effect size and total sample size below (remember, when entering sample sizes into jamovi, you are entering
the sample size for one group), and round your answers to three decimal places.
Assuming effect size = 0.5:
i. When total n = 6, power =
ii. When total n = 30, power =
ii, When total n = 80, power =
For effect size = 0.8:
i. When total n = 6, power =
ii. When total n = 30, power =
iji, When total n = 80, power =
f. Suppose it turns out that the true population effect size is much smaller than we thought, e.g. d = 0.1. Also suppose we use a small sample size, e.g. n = 20.
which of the following should be true? Select all that apply.
We will probably reject HO
- We will probably fail to reject HO
We will probably commit a Type I error
We will probably commit a Type II error
In order to detect a "significant" difference, we will have to underestimate the true difference in mean litter sizes
In order to detect a "significant" difference, we will have to overestimate the true difference in mean litter sizes
Expert Solution
This question has been solved!
Explore an expertly crafted, step-by-step solution for a thorough understanding of key concepts.

This is a popular solution!

Trending now
This is a popular solution!

Step by step
Solved in 2 steps

Recommended textbooks for you
MATLAB: An Introduction with Applications
Statistics
ISBN:
9781119256830
Author:
Amos Gilat
Publisher:
John Wiley & Sons Inc

Probability and Statistics for Engineering and th…
Statistics
ISBN:
9781305251809
Author:
Jay L. Devore
Publisher:
Cengage Learning

Statistics for The Behavioral Sciences (MindTap C…
Statistics
ISBN:
9781305504912
Author:
Frederick J Gravetter, Larry B. Wallnau
Publisher:
Cengage Learning
MATLAB: An Introduction with Applications
Statistics
ISBN:
9781119256830
Author:
Amos Gilat
Publisher:
John Wiley & Sons Inc
Probability and Statistics for Engineering and th…
Statistics
ISBN:
9781305251809
Author:
Jay L. Devore
Publisher:
Cengage Learning
Statistics for The Behavioral Sciences (MindTap C…
Statistics
ISBN:
9781305504912
Author:
Frederick J Gravetter, Larry B. Wallnau
Publisher:
Cengage Learning

Elementary Statistics: Picturing the World (7th E…
Statistics
ISBN:
9780134683416
Author:
Ron Larson, Betsy Farber
Publisher:
PEARSON

The Basic Practice of Statistics
Statistics
ISBN:
9781319042578
Author:
David S. Moore, William I. Notz, Michael A. Fligner
Publisher:
W. H. Freeman

Introduction to the Practice of Statistics
Statistics
ISBN:
9781319013387
Author:
David S. Moore, George P. McCabe, Bruce A. Craig
Publisher:
W. H. Freeman