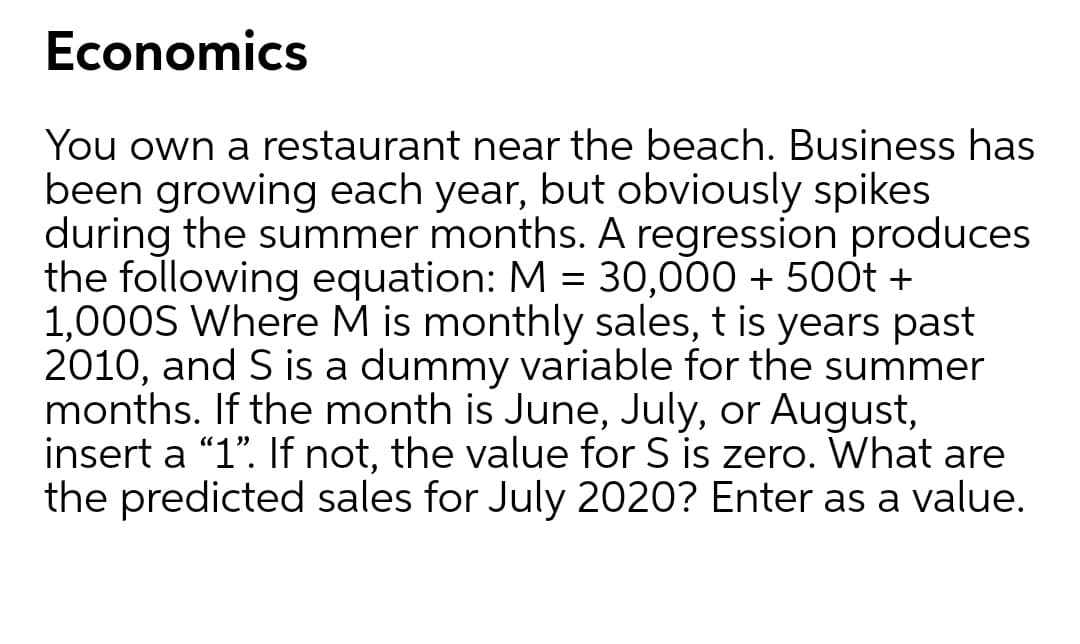
You own a restaurant near the beach. Business has been growing each year, but obviously spikes during the summer months. A regression produces the following equation: M = 30,000 + 50ột + 1,000S Where M is monthly sales, t is years past 2010, and S is a dummy variable for the summer months. If the month is June, July, or August, insert a "1". If not, the value for S is zero. What are the predicted sales for July 2020? Enter as a value.
Q: Comprehensively state the criteria and process of selecting appropriate models for time series…
A: Time series forecasting is used when making scientific forecasts based on historical time stamped…
Q: Company A wants to forecast future demand using the time series forecasting technique. The analyst…
A: The method is demand forecasting. It's used to forecast and estimate a product's or service's future…
Q: True/False 1. Omitting a variable that effects Y always biases or estimate for ß. 2. If the model is…
A: Note: Since we only answer up to 3 sub-parts, we’ll answer the first 3. Please resubmit the…
Q: The number of heart surgeries performed at Heartville General Hospital has increased steadily over…
A: Exponential smoothing is often utilized for the analysis of time-series data. Exponential smoothing…
Q: If the annual rate of world oil consumption t years after 1970 is modeledby the equation R(t) =…
A: In economics, consumption refers to the use of goods and services. The expenditure made on the…
Q: Use simple exponential smoothing with a = 0.6 to forecast the tire sales for September through…
A: Forecasting sales refers to the prediction of future sales using previous data to estimate the…
Q: True or False ? Justify your answers. A quadratic trend model y = B1 + B2TIME + B3TIME? + &t is…
A: 1 A quadratic trend model y = B 1 + B ₂TIME + B 3 Time 3 + et is considered a linear regression.…
Q: Consider following regressions: Y = a₁ + a₂X+U Y* =b₁ + b₂X* + V Where: Y = mY, X* =nX D Show that:…
A: Y = a1 + a2 X + U_____________[1] After scaling, regression: Y* = b1 + b2 X* + V mY = b1 + b2 (nX) +…
Q: In the December, 1969, American Economic Review (pp. 886-896), Nathanial Leff reports the following…
A: Given information log S/Y = 7.3439 + 0.1596 log Y/N + 0.0254 log G - 1.3520 log D1 - 0.3990 log D2…
Q: Suppose you decide to estimate a student consumption function. After you run an OLS regression on…
A: The regression equation studies the magnitude of relationship between the dependent variable and the…
Q: Simple Regression Sales Revenue Year Product Price (P) (millions of pesos) 1 1.20 0.95 1.50 0.93 3…
A: Regression is a statistical technique used in finance, investing, and other fields to identify the…
Q: Which of the following is NOT TRUE about trend analysis? a) In trend analysis every item is…
A: Economics as a subject deals with the allocation of scarce resources among humans with unlimited…
Q: Choose one of the following forecasting methods discussed in this chapter: last-value, averaging,…
A: Exponential smoothing is commonly used to make short term forecasts, yet longer-term estimates…
Q: 2. (2) Answer each of the following: a) Suppose that a simple regression has quantities N=24,…
A: a) R2 = SSRSST =2037.93524.6=0.578 Therefore, R2 = 0.578 b) SSE = (1-R2)×SST = (1-0.54)*1926.3 =…
Q: Suppose you are employed by the Central Bank and given the task to analyze saving behavior of the…
A: We are going to use linear regression analysis to answer this question.
Q: Use Exponential Models in Applications In the following exercises, solve. In the last five years…
A: Answer: The formula of exponential population growth is given below: A=A0ektwhere,A=ending…
Q: The base amount in gradient series stars at the beginning of the second period. Select one: True…
A: In gradient series there is a constant increase / decrease in the cash flow.
Q: onential Smoothing with the following parameters: Ft+1=32 and the α = .15 Regression Months 1 2 3 4…
A: *Answer: . Forecasts are useful tools for making predictions and analyzing future outcomes.…
Q: A local moving company has collected data on the number of moves they have been asked to perform…
A: The equation for the trend line of yearly sales is given: Ft = 16 + 60t
Q: QUESTION 1 Which of the following is NOT a time-series model? a. Moving averages b. Exponential…
A: Time series model This kind of model uses recorded information as the way to solid forecasting.…
Q: which sentences are correct? 1.Decomposition methods assume that the actual time series value at…
A: We are going to use time series econometrics concept to answer the question. Note: Due to StudyMode…
Q: If the annual rate of world oil consumption t years after 1970 is modeled by the equation R(t) =…
A: We are going to find the total consumption of oil barrels in a period from 1976 to 1980 to answer…
Q: In a linear model with the typical equation: Y = B*X + u, which of the following statements is true?…
A: Multi-correlation refers to a situation where two or more independent variables (also called feature…
Q: Suppose that a researcher collects data on houses that have sold in a particular neighborhood over…
A: Standard errors are reported in brackets. Coefficient is significant if null hypothesis is rejected.…
Q: Question 7: The following regressions are based on the CPI data for the United States for the period…
A: Stationary Stochastic processes are those process which have a constant mean and constant variance…
Q: If we run a regression where y (bankruptcy) = f (factors potentially predicting bankruptcy), what is…
A: Bankruptcy refers to the form of a legal process through which people or any other entities who fail…
Q: ANSWER 1-5 IF TRUE OR FALSE 1. As an initial attempt, we use multiple line chart to see trend and…
A: "Since you have asked multiple questions, we will solve first question for you .. If you want any…
Q: A scatter plot shows data for the cost of a vintage car from a dealership (y in dollars) in the year…
A: The researchers and policymakers generally use a regression model to get the best result from their…
Q: Perform a linear regression that relates bar sales to guests (not to time). b) If the forecast is…
A: A linear regression is a statistical and mathematical concept which helps to study the relationship…
Q: You are running a probability regression. If your data contains many outliers, you’d be better off…
A: Probability regression is the statistical fitting of an s-curve logistic or logit function to a data…
Q: Given the regression equationY = -50 + 12Xa. What is the change in Y when X changes by +3?b. What is…
A: Since we only answer up to 3 sub-parts, we’ll answer the first 3. Please resubmit the question and…
Q: A firm experienced the demand shown in the following table. Fill in the table by preparing forecasts…
A: Compute 5-year moving average demand forecast using Fy = (Dy-1 + Dy-2 + Dy-3 + Dy-4 + Dy-5) / 5…
Q: The accompanying data table show the percentage of tax returns filed electronically in a city from…
A: Given data,
Q: A static model is postulated when a change in the independent variable at time T is believed to have…
A: A static model is used for calculating the parameter in equilibrium, i.e., at instant/immediate time…
Q: Suppose in a static or distributed lag time series regression, you are able to use n =280 quarterly…
A: Newly west estimator is used to provide estimation of covariance matrix of a regression type…
Q: What is the model constant when the dummy variable equals 1 in the following equations, where x1 is…
A: Dummy variable is the categorical variable that can take only two values; 0 and 1, which describes…
Q: A researcher has a sample of 6 annual observations {94, 104, 102, 99, 111 and 107} for the CPI in…
A: The Consumer Price Index is a weighted average of expenses for a basket of goods and services, such…
Q: a)X*u b) 0 c) u d) none of tha above
A: The term 'linear model' is used in different ways depending on the context. The most common…
Q: Given the estimated multiple regression equation ŷ = 6 + 5x1 + 4x2 + 7x3 + 8x4 what is the predicted…
A: Multiple linear regression is used to explain the relationship between two or more independent…
Q: Consider the following bivariate linear regression model y = a+3x+u. Suppose that E[u|x] # 0 and…
A: x : Endogenous variable z: Instrument for x The IV estimate of B = cov(y, z)cov(x, z) = 0.50.5 = 1
Q: consider a regression model Yi=B1+B2Xi+ui and you estimated B2hat =0.3. This implies that a unit…
A: When B2hat = 0.3 Then a unit change in x is predicted to 0.3 unit change in Y.
Q: The regression results below show the relationship between GDP (Y) and private consumption (X) for…
A:
Q: Question Three For the past 10 years, you have been observing the sales of your company since you…
A: 1. To determine the relationship between the two variable sales and advertisement expenses, we will…
Q: 6. The following two regression models are Probit and Logit respectively: Pr(Y=1|X)= Pr(Y=1|X)=F(B+B…
A: since you have asked multiple questions and according to policy we can solve only 1 question and for…
Q: 1. Suppose that you have following data: Variable Description CEO salary measured in thousands of $…
A: AS PER THE GUIDELINE I HAVE SOLEVD FIRST THREE SUBPARTS. PLEASE POST OTHE QUESTIONS SEPRATELY.
Q: The following is the data of recent refrigerator sales at a local Home Depot store. Month 1 2 3…
A: Weighted moving averages assign a heavier weighting to more current data points since they are more…
Trending now
This is a popular solution!
Step by step
Solved in 2 steps
- Given the regression equationY = 43 + 10Xa. What is the change in Y when X changes by +8?b. What is the change in Y when X changes by -6?c. What is the predicted value of Y when X = 11? d. What is the predicted value of Y when X = 29? e. Does this equation prove that a change in X causes a change in Y?If we run a regression where y (bankruptcy) = f (factors potentially predicting bankruptcy), what is the dependent variable?In the December, 1969, American Economic Review (pp. 886-896), Nathanial Leff reports thefollowing least squares regression results for a cross section study of the effect of age composition onsavings in 74 countries in 1964:log S/Y = 7.3439 + 0.1596 log Y/N + 0.0254 log G - 1.3520 log D1 - 0.3990 log D2 (R2= 0.57)log S/N = 8.7851 + 1.1486 log Y/N + 0.0265 log G - 1.3438 log D1 - 0.3966 log D2 (R2= 0.96)where S/Y = domestic savings ratio, S/N = per capita savings, Y/N = per capita income, D1 = percentage ofthe population under 15, D2 = percentage of the population over 64, and G = growth rate of per capitaincome. Are these results correct? Explain..
- You estimated the following regression. What value would you predict for Y, if X = 47? (Round your final answer to zero decimal places.) Source | SS df MS Number of obs = 324 -------------+---------------------------------- F(1, 322) = 354.54 Model | 3686788 1 3686788 Prob > F = 0.0000 Residual | 3348384.74 322 10398.7104 R-squared = 0.5241 -------------+---------------------------------- Adj R-squared = 0.5226 Total | 7035172.74 323 21780.7206 Root MSE = 101.97 ------------------------------------------------------------------------------ Y | Coef. Std. Err. t P>|t| [95% Conf. Interval] -------------+---------------------------------------------------------------- X | 24.51522 1.301971 18.83 0.000 21.95378 27.07666 _cons | 98.70791 117.4919 0.84 0.401…1. R-squaredSuppose regression of y on an intercept and x with 50 observations yields total sum of squares 100 andexplained sum of squares 36.(a) What is ?^2?(b) What is the correlation coefficient between y and x?(c) What is the standard error of the residual?q16b- A researcher is estimating an equation for sales of a company considering a range of independent variables. Which case should be modelled with a dummy variable? Select one: a. the effect of price b. the effect of advertising expenditure c. the effect of seasonality d. the effect of inflation Clear my choice
- The following gives the number of accidents that occurred on Florida State Highway 101 during the last 4 months: Jan Feb Mar AprMonth 1 2 3 4Number of Accidents 30 40 70 105 Using the least-squares regression method, the trend equation for forecasting is (round your responses to two decimal places): y = ? + ?xQ. Rubax, a U.S. manufacturer of athletic shoes, estimates the following linear trend model for show sales: Qt = a + bt + c1D1 + c2D2 + c3D3 Qt = sales of athletic shoes in the tth quarter t = 1, 2,..., 28 [2014(I), 2014(II),....,2020[IV)] D1 = 1 if t is quarter I (winter); 0 otherwiseD2 = 1 if t is quarter II (spring); 0 otherwiseD3 = 1 if t is quarter III (summer); 0 otherwise The regression analysis produces the following results: a. Is there sufficient statistical evidence of an upward trend in shoe sales? b. Do these data indicate a statistically significant seasonal pattern of sales of Rubax shoes? If so, what is the seasonal pattern exhibited by the data? c. Using the estimated forecast equation, forecast sales of Rubax shoes for 2021(III) and 2022(II). d. How might you improve this forecast equation? Thank you!In the linear model ,E (X*u) = a)X*u b) 0 c) u d) none of tha above
- DEPENDENT VARIABLE Qc R- SQUARE P- VALUE ON F 64 0.8093 0.0001 INDEPENDENTVARIABLE PARAMETER ESTIMATE STANDARD ERROR T-RATIO P-VALUE INTERCEPT 8.20 4.01 2.04 0.0461 PC -3.54 1.64 -2.16 0.0357 M 0.64287 0.19 3.38 0.0014 PA 0.7854 0.38 2.07 0.0439 10. Write the resulting regression equation. Q = f( P, M, PR) where Qc = demand for cement/month (in yards) Pc = the price of cement per yard, M = country’s tax revenues per capita, and PR = the price of asphalt per yard.A researcher has a sample of 6 annual observations {94, 104, 102, 99, 111 and 107} for the CPI in country Z for the period 2015 to 2020, and wants to forecast CPI for the years 2021, 2022 and 2023. The researcher uses 3 different forecasting models: A, B and C. Model A is an AR(1) model with no drift and with an estimated autoregressive coefficient = 0.7. Model B is a MA(1) model with no constant and with an estimated MA coefficient = -0.4 (note the minus !). Model C is a random walk model with no drift. The error terms over the 2015-2020 period were estimated to have the values: {3, -1, 2, 4, -3, 1}. a. Compute the 2021, 2022 and 2023 forecasted values for the consumer price index based on the three models. Show the formulas and the details of your calculations, and explain all the related symbols. b. Suppose that the actual values of the CPI over the 2021, 2022 and 2023 were {108, 114, 105}. Calculate the Root mean square error of the three model forecasts over the 2021-2023…Hello, please help me to solve the question (c) and (d) below.Consider this regression model (1) : Yt = β0 + β1 Ut + β2 Vt + β3 Wt + β4 Xt + εt ; where t= 1, ..., 75.We use OLS to estimate the parameters, producing the following model:Ŷt = 1.115 + 0.790 Ut − 0.327 Vt + 0.763 Wt + 0.456 Xt (0.405) (0.178) (0.088) (0.274) (0.017) Given that:R2 = 0.941; Durbin Watson stat DW = 1.907; RSS = 0.0757.(To answer the question, use the 5% level of significance, state clearly H0 and H1 that are tested, the test statistics that are used, and interpret the decisions.) (a) Describe the concepts of unbiasedness and efficiency. State the conditions required of regression (1) in order that the OLS estimators of the model parameters possess these properties. (b) Perform the following tests on the parameters of regression (1): (i) test whether the parameters β1, β2, β3 and β4 are individually statistically significant; (ii) test the overall significance of the regression model;…