Use simple exponential smoothing with a = 0.6 to forecast the tire sales for September through December. Assume that the forecast for August was for 46 sets of tires. Do your forecasts seem to be biased? Why or why not? Month Sales 53 August September35 October 48 November 40
Use simple exponential smoothing with a = 0.6 to forecast the tire sales for September through December. Assume that the forecast for August was for 46 sets of tires. Do your forecasts seem to be biased? Why or why not? Month Sales 53 August September35 October 48 November 40

Managerial Economics: Applications, Strategies and Tactics (MindTap Course List)
14th Edition
ISBN:9781305506381
Author:James R. McGuigan, R. Charles Moyer, Frederick H.deB. Harris
Publisher:James R. McGuigan, R. Charles Moyer, Frederick H.deB. Harris
Chapter5: Business And Economic Forecasting
Section: Chapter Questions
Problem 5E: A firm experienced the demand shown in the following table. *Unkown future value to be forecast Fill...

Related questions
Question
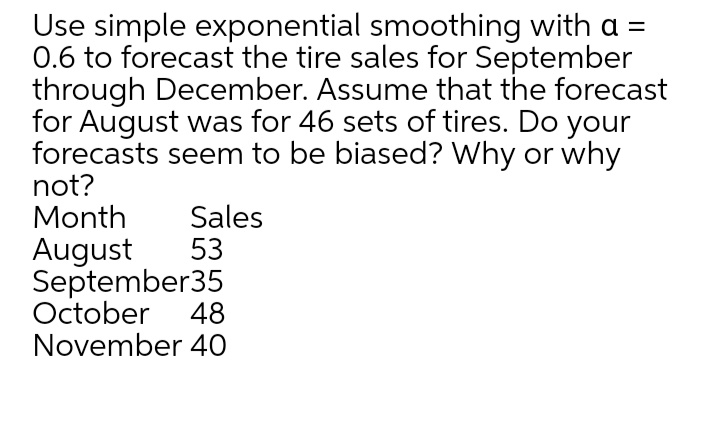
Transcribed Image Text:Use simple exponential smoothing with a =
0.6 to forecast the tire sales for September
through December. Assume that the forecast
for August was for 46 sets of tires. Do your
forecasts seem to be biased? Why or why
not?
Month
Sales
August
53
September35
October 48
November 40
Expert Solution
This question has been solved!
Explore an expertly crafted, step-by-step solution for a thorough understanding of key concepts.

This is a popular solution!

Trending now
This is a popular solution!

Step by step
Solved in 2 steps with 2 images

Knowledge Booster


Learn more about
Need a deep-dive on the concept behind this application? Look no further. Learn more about this topic, economics and related others by exploring similar questions and additional content below.Recommended textbooks for you
Managerial Economics: Applications, Strategies an…
Economics
ISBN:
9781305506381
Author:
James R. McGuigan, R. Charles Moyer, Frederick H.deB. Harris
Publisher:
Cengage Learning
Managerial Economics: Applications, Strategies an…
Economics
ISBN:
9781305506381
Author:
James R. McGuigan, R. Charles Moyer, Frederick H.deB. Harris
Publisher:
Cengage Learning