Yuehua Telecom Inc. and Guangxin Technology Ltd. are two competing ICT corporations based in Shenzhen Special Economic Zone, China. Both companies’ stocks are traded at Shenzhen Stock Exchange. The comparative financial statements of Yuehua and Guangxin for the last four years (2016 – 2019) are shown in the Attachments 1 and 2: Instructions: (B) Evaluate each company’s trends for sales, gross profit, and net income as disclosed on the comparative income statement.
Yuehua Telecom Inc. and Guangxin Technology Ltd. are two competing ICT corporations based in Shenzhen Special Economic Zone, China. Both companies’ stocks are traded at Shenzhen Stock Exchange. The comparative financial statements of Yuehua and Guangxin for the last four years (2016 – 2019) are shown in the Attachments 1 and 2: Instructions: (B) Evaluate each company’s trends for sales, gross profit, and net income as disclosed on the comparative income statement.

Cornerstones of Financial Accounting
4th Edition
ISBN:9781337690881
Author:Jay Rich, Jeff Jones
Publisher:Jay Rich, Jeff Jones
Chapter4: Internal Control And Cash
Section: Chapter Questions
Problem 69.3C

Related questions
Question
Yuehua Telecom Inc. and Guangxin Technology Ltd. are two competing ICT corporations based in Shenzhen Special Economic Zone, China. Both companies’ stocks are traded at Shenzhen Stock Exchange. The comparative financial statements of Yuehua and Guangxin for the last four years (2016 – 2019) are shown in the Attachments 1 and 2:
Instructions:
(B) Evaluate each company’s trends for sales, gross profit, and net income as disclosed on the comparative income statement.
![Attachment 2: Comparative Income Statement
Comparative Income Statement
Yuehua Telecom Inc. and Guangxin Technology Ltd.
For the Years Ended at December 31: 2016, 2017, 2018, 2019
(Currency Unit in Million Chinese Yuan, ¥1,000,000)
Yuehua Telecom Inc.
Guangxin Technology Ltd.
2019
2018
2017
2016
2019
2018
2017
2016
Sales
Cost of Goods Sold
009*
460
¥540
430
110
¥528
¥516
410
¥330
105
225
¥330
420
108
¥320
100
220
¥270
06
180
75
Gross Profit
140
106
145
Operating Expenses
Income from Operations
Interest Expense
Income (Loss) before Income Taxes
Income Taxes [(Recovered)]
Net Income (Loss)
56
84
50
60
50
58
50
56
85
140
60
80
105
100
120
60
60
96
86
60
24
40
14
70
60
(20)
[(10)]
半(10)
60
58
56
35
¥35
29
¥29
28
半28
40
¥40
30
30
12
¥12
¥30
¥30
Dividends Declared
Preferred
Common
¥20
¥0
¥10
¥12
¥10
¥10
¥10
¥10
¥10
¥10
¥10
¥10
¥10
¥15
¥0
¥10
Market Price Per Common Share
¥1,250
¥1,000
¥950
¥900
¥800
¥200
¥1,200
¥100
(In Single-Unit Chinese Yuan, Not in Million)
* According to the tax law of Shenzhen Special Economic Zone, a 'strategic' ITC company that suffered a loss in a fiscal year can ask for a
refund of 50% (i.e., corporate tax rate) of the loss amount from the tax paid in previous fiscal year. So '[(10)]' means Guangxin got a ¥10
million refund of tax from government. Thus, the net loss for Guangxin for 2018 is: - 20 - (- 10) = - 20 + 10 = – 10.](/v2/_next/image?url=https%3A%2F%2Fcontent.bartleby.com%2Fqna-images%2Fquestion%2Fcc82daa2-f311-483c-a702-c2deee1df248%2Ffa4d385e-d6f1-4651-b429-8084fd734c59%2Ftdr8hvm_processed.png&w=3840&q=75)
Transcribed Image Text:Attachment 2: Comparative Income Statement
Comparative Income Statement
Yuehua Telecom Inc. and Guangxin Technology Ltd.
For the Years Ended at December 31: 2016, 2017, 2018, 2019
(Currency Unit in Million Chinese Yuan, ¥1,000,000)
Yuehua Telecom Inc.
Guangxin Technology Ltd.
2019
2018
2017
2016
2019
2018
2017
2016
Sales
Cost of Goods Sold
009*
460
¥540
430
110
¥528
¥516
410
¥330
105
225
¥330
420
108
¥320
100
220
¥270
06
180
75
Gross Profit
140
106
145
Operating Expenses
Income from Operations
Interest Expense
Income (Loss) before Income Taxes
Income Taxes [(Recovered)]
Net Income (Loss)
56
84
50
60
50
58
50
56
85
140
60
80
105
100
120
60
60
96
86
60
24
40
14
70
60
(20)
[(10)]
半(10)
60
58
56
35
¥35
29
¥29
28
半28
40
¥40
30
30
12
¥12
¥30
¥30
Dividends Declared
Preferred
Common
¥20
¥0
¥10
¥12
¥10
¥10
¥10
¥10
¥10
¥10
¥10
¥10
¥10
¥15
¥0
¥10
Market Price Per Common Share
¥1,250
¥1,000
¥950
¥900
¥800
¥200
¥1,200
¥100
(In Single-Unit Chinese Yuan, Not in Million)
* According to the tax law of Shenzhen Special Economic Zone, a 'strategic' ITC company that suffered a loss in a fiscal year can ask for a
refund of 50% (i.e., corporate tax rate) of the loss amount from the tax paid in previous fiscal year. So '[(10)]' means Guangxin got a ¥10
million refund of tax from government. Thus, the net loss for Guangxin for 2018 is: - 20 - (- 10) = - 20 + 10 = – 10.
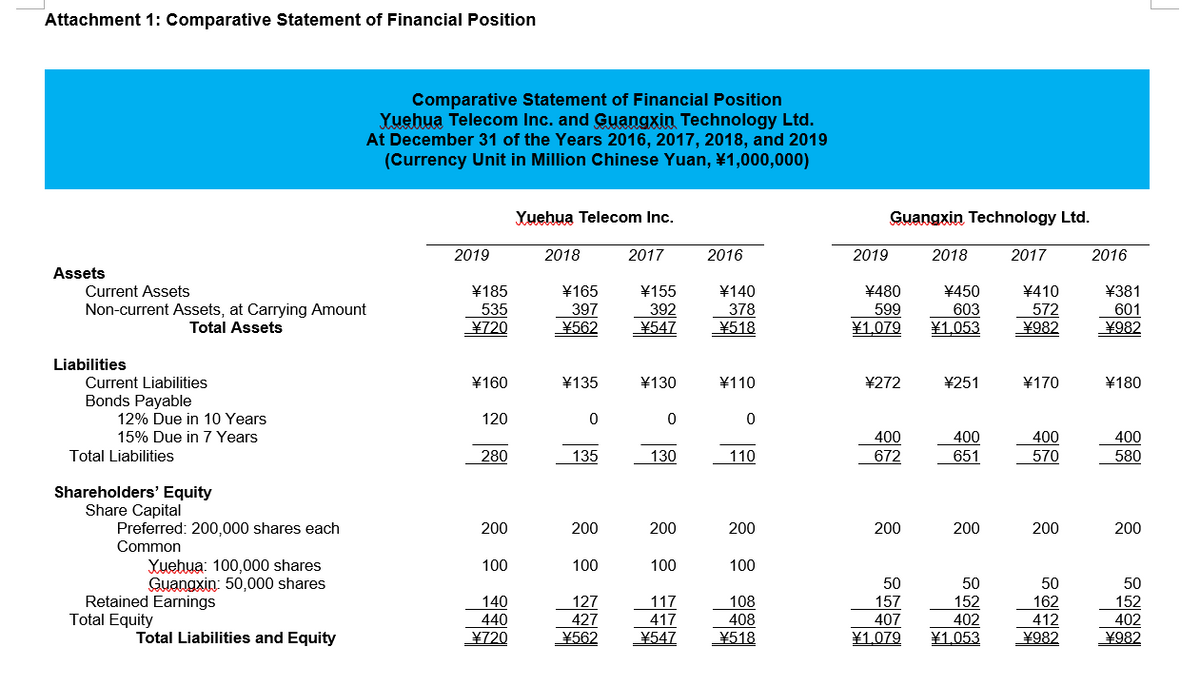
Transcribed Image Text:Attachment 1: Comparative Statement of Financial Position
Comparative Statement of Financial Position
Yuehua Telecom Inc. and Guangxin Technology Ltd.
At December 31 of the Years 2016, 2017, 2018, and 2019
(Currency Unit in Million Chinese Yuan, ¥1,000,000)
Yuehua Telecom Inc.
Guangxin Technology Ltd.
2019
2018
2017
2016
2019
2018
2017
2016
Assets
Current Assets
¥185
535
¥165
397
¥562
¥155
392
¥547
¥140
378
¥518
¥480
599
¥450
603
¥1.053
¥410
572
¥982
¥381
Non-current Assets, at Carrying Amount
Total Assets
601
¥982
¥720
¥1,079
Liabilities
半180
Current Liabilities
Bonds Payable
¥160
¥135
¥130
¥110
¥272
¥251
¥170
12% Due in 10 Years
15% Due in 7 Years
120
400
672
400
400
400
580
Total Liabilities
280
135
130
110
651
570
Shareholders' Equity
Share Capital
Preferred: 200,000 shares each
Common
200
200
200
200
200
200
200
200
100
100
Yuehua: 100,000 shares
Guangxin: 50,000 shares
100
100
50
157
407
50
Retained Earnings
Total Equity
50
162
412
50
152
140
127
427
117
417
108
408
152
440
402
402
Total Liabilities and Equity
羊720
¥562
¥547
¥518
¥1,079
¥1,053
¥982
¥982
Expert Solution
This question has been solved!
Explore an expertly crafted, step-by-step solution for a thorough understanding of key concepts.

Step by step
Solved in 2 steps with 2 images

Knowledge Booster


Learn more about
Need a deep-dive on the concept behind this application? Look no further. Learn more about this topic, accounting and related others by exploring similar questions and additional content below.Recommended textbooks for you
Cornerstones of Financial Accounting
Accounting
ISBN:
9781337690881
Author:
Jay Rich, Jeff Jones
Publisher:
Cengage Learning

Intermediate Accounting: Reporting And Analysis
Accounting
ISBN:
9781337788281
Author:
James M. Wahlen, Jefferson P. Jones, Donald Pagach
Publisher:
Cengage Learning
Cornerstones of Financial Accounting
Accounting
ISBN:
9781337690881
Author:
Jay Rich, Jeff Jones
Publisher:
Cengage Learning
Intermediate Accounting: Reporting And Analysis
Accounting
ISBN:
9781337788281
Author:
James M. Wahlen, Jefferson P. Jones, Donald Pagach
Publisher:
Cengage Learning