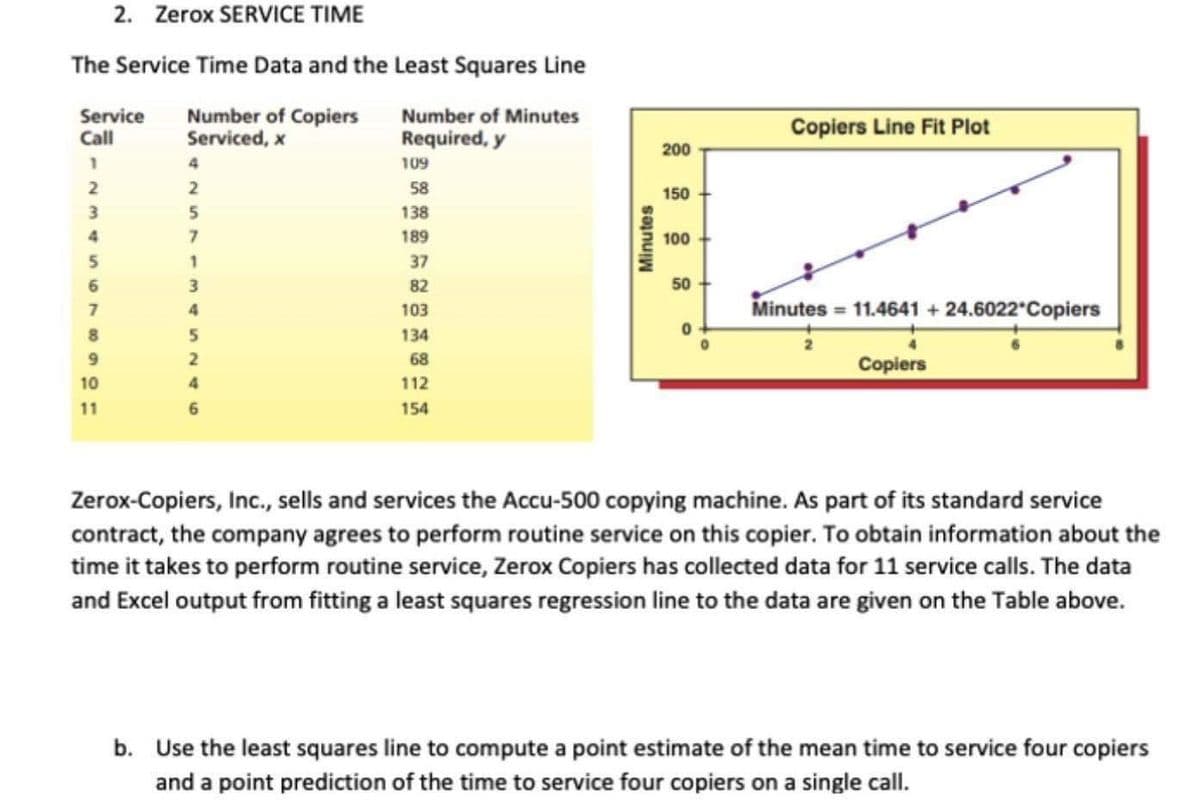
Zerox-Copiers, Inc., sells and services the Accu-500 copying machine. As part of its standard service contract, the company agrees to perform routine service on this copier. To obtain information about the time it takes to perform routine service, Zerox Copiers has collected data for 11 service calls. The data and Excel output from fitting a least squares regression line to the data are given on the Table above. b. Use the least squares line to compute a point estimate of the mean time to service four copiers and a point prediction of the time to service four copiers on a single call.
Q: blood pressure measurement consists of two numbers: the systolic pressure, which is the maximum…
A: Given Systolic Diastolic 130 76 116 70 133 91 112 75 134 87…
Q: When using the least-squares line for prediction, are results more reliable for extrapolation or…
A: The method of predicting the yˆ values using the x values that are between the observed values in…
Q: An article included a summary of findings regarding the use of SAT I scores, SAT II scores, and high…
A: Note: Hi there! Thank you for posting the question. As there are several independent questions,…
Q: The least squares regression line is displayed on the provided scatterplot. Note that the points are…
A:
Q: A scatterplot of student height, in inches, versus corresponding arm span length, in inches, is…
A: Correct statement is The slope of the least squares regression line increases and the correlation…
Q: random sample of 65 high school seniors was selected from all high school seniors at a certain high…
A: Solution
Q: A chemical company, seeking to study the effect of extraction time on the efficiency of an…
A: Given : A chemical company, seeking to study the effect of extraction time on the efficiency of an…
Q: What effect does the circled point have on the slope and y-intercept of the least-squares regression…
A: The regression line is given by,y^=β0^+β1^xWhere,y^ : Estimated response variableβ0^ : Estimated…
Q: The following activity and cost data that were provided by Hoist Corporation would help in…
A: Regression line are used to predict the observations. It explains the relationship between the…
Q: Which of the following are feasible equations of a least squares regression line for the change in a…
A: Given data 1. y^ = 75,000 + 4400x 2. y^ = 75,000 - 4400x 3. y^ = -75,000 + 4400x 4. y^ = -75,000 -…
Q: 13. In the National Hockey League, a good predictor of the percentage of games won by a team is the…
A: The fitted regression line is Winning percentage(%) = 116.95 - 0.26 Goal Allowed Hence, When the…
Q: 2) Fit a straight line to the data shown below using least squares met
A: Given, x 2 3 4 5 6 y 3 6 7 12 14
Q: Like father, like son: In 1906, the statistician Karl Pearson measured the heights of 1078 pairs of…
A: Given: y^=50.5230+0.2781x∑x-x¯2=41.2733α=0.05 x y 69.3 71.4 66.7 68.8 70.7 71 65.7 70.9…
Q: (a) sketch the line that appears to be the best fit for the given points, (b) find the least squares…
A: (a) Scatter plot is used to investigate the relationship between the points plotted. It is obtained…
Q: Zerox-Copiers, Inc., sells and services the Accu-500 copying machine. As part of its standard…
A: Consider the data that contains the information of the time to service the copiers. The least-square…
Q: The following data is about the number of turns required to break a certain type of forged alloy…
A: Use EXCEL to determine the regression equation. EXCEL procedure: Go to EXCEL Go to Data>Data…
Q: From the below table, Use excels to find the answer for the below questions: State Percentage…
A: Solution: Let X be the percentage proficient in reading and Y be the percentage proficient in…
Q: Suppose a least-squares regression line is given by y=4.302x−3.293. What is the mean value of the…
A: Given: The regression line is: y=4.302x−3.293
Q: A manager at the Camden Walmart is interested in learning more about the relationship between the…
A: a) Here, the constant given in the table is 72.95. The "customers in the line" is 174.40 So, the…
Q: Four weather stations are placed along a straight road x kilometres from a marker, and the minimum…
A:
Q: 2.1 Determine the equation of the least squares regression line. 2.2 Identify the outlier. 2.3…
A: Hello! As you have posted more than 3 sub parts, we are answering the first 3 sub-parts. In case…
Q: 9. A study was conducted to determine the correlation between the number of absences and the final…
A: Solution
Q: Is a baseball players' slugging percentage correlated to their strikeout percentage? A random sample…
A:
Q: The following information pertains to data that have been gathered in the process of estimating a…
A: Simple linear regression or least square equation is used to predict the value of a response…
Q: 1. How does the cost of shipping a standard-sized crate relate to the distance of the destination?…
A: Given that The excel output using regression is
Q: An advertising firm wishes to demonstrate to its clients the effectiveness of the advertising…
A: The independent variable is Campaign cost. The dependent variable is Increase in sales. This is…
Q: The following represents math and English SAT scores for 8 freshmen. English 440 435 380 610 375 490…
A: Given data: The math and English SAT scores for 8 freshmen as follows: English Math 435 340…
Q: Based on the least-squares criterion, the line that best fits a set of data points is the one with…
A: Least square criterion: The least square criterion is that the line that best fits a set of data…
Q: The following scatterplot shows two variables along with a least-squares regression line. y 26- 24-…
A: Identify the correct option for the outlier that represented in the Scatterplot. The correct…
Q: Researchers measured the percent body fat and the preferred amount of salt (percent weight/volume)…
A: Data given x y 0.2 20 0.3 30 0.4 22 0.5 30 0.6 38 0.8 23 1.1 30
Q: In regression, the line that best summarizes the relationship between X and Y is called the “least…
A: The least squares regression line is the line of best fit that makes the vertical distance of the…
Q: Chest (in). 49 35 41 41 63 57 Weight (Ib) 348 166 320 262 390 290 Use the least squares regression…
A: Given data: The table of the chest size (inches) and weight of the bear (lb) is provided. Let x be…
Q: To help plan book acquisitions for the next year, a public library collected data on a sample of its…
A:
Q: a. Compute the least squares regression line. b. On average, for each additional thousand dollars…
A: here given x= advertising expenditure (in thousands of dollars ) y = sale (in thousands of dollars…
Q: Is the number of games won by a major league baseball team in a season related to the team's batting…
A: The least square prediction equation is, Y = a + bx
Q: Compute the least- squares regression line for the given data set: x 1 2 3 4 5 y 5 6 9 8…
A: The least square regression line is obtained below:Step-by-step procedure to obtain Regression…
Q: a) Find the least square regression line for the following set of data {(-1 , 0),(0 , 2),(1 , 4),(2…
A:
Q: Data were recorded for a car’s fuel efficiency, in miles per gallon (mpg), and corresponding speed,…
A: given regression line Fuel efficiency = 1.437 + 0.541 (speed )
Q: The following are relative peak areas for chro- matograms of standard solutions of methyl vinyl…
A: Here we want to (c) calculate the concentration of MVK (d) calculate the absolute and relative…
Q: The following table presents the ages of 8 U.S. presidents and their wives on the first day of…
A:
Q: The method of Least Squares works by fitting the best fit line through which of the following…
A: The method of least square is to minimize the error and error is the sum of the square of dependent…
Q: A blood pressure measurement consists of two numbers: the systolic pressure, which is the maximum…
A: Given Systolic Diastolic 124 84 106 84 102 77 113 77 118 66 117 87 130 74 115 70…
Q: Compute for the Variable Rate for utilities cost per meal served and the 1. High-Low method 2. Least…
A: Month Meals Served Utilities cost Dec 55 40100 Jan 30 36000 Feb 25 34700 Mar 40 38550 Apr…
Q: An engineer wants to determine how the weight of a gas powered car, x, affects gas mileage, y. The…
A: Calculate Fitting a straight line - Curve fitting using Least square method X Y 3797 16 3897…
Q: Describe in your own words what it means to perform a linear least squares analysis. Provide an…
A: Regression is used to predict the value of dependent variable by using the one or two independent…
Q: Like father, like son: In 1906, the statistician Karl Pearson measured the heights of 1078 pairs of…
A:
Q: A statistics student is studying if there is a relationship between the price of a used car and the…
A: Solution: The computer output for the regression analysis is given.
Q: The materials handling manager of a manufacturing com-pany is trying to forecast the cost of…
A: Y on X regression line is, Y=a+bXwhere Y depends on X.a is the intercept b is the slope of the line…
Q: 1. What is the equation of the least squares regression line for predicting their weights from their…
A: Linear Regression: It is a model with one dependent variable with one independent variable to…
Trending now
This is a popular solution!
Step by step
Solved in 2 steps
- Various doses of a poisonous substance were givento groups of 25 mice and the following results wereobserved: Dose (mg) Number of deathsx y4 16 38 610 812 1414 1616 20 (a) Find the equation of the least squares line fit tothese data.(b) Estimate the number of deaths in a group of 25 micethat receive a 7-milligram dose of this poison.Suppose 5 out of 25 data points in a weighted least-squares problem have a y-measurement that is less reliable than the others, and they are to be weighted half as much as the other 20 points. One method is to weight the 20 points by a factor of 1 and the other 5 by a factor of 1/2. A second method is to weight the 20 points by a factor of 2 and the other 5 by a factor of 1. Do the two methods produce different results? Explain.The Greer Tire company manufactures a new steel-belted radial tire to be sold through a national chain of discount stores. Because the tire is a new product, Greer’s managers believe that the mileage guarantee offered with the tire will be an important factor in the acceptance of the product. Let X = miles that the tires last: X~N(60,000 2,500) Find the mileage guarantee that ensures this company will repair no more than 15% of its product for free. Assume the distribution of tire mileage is normal.
- Percentages of public school students in fourth and eighth grades who were above the proficiency level were given for 8 western states 4th Grade Proficiency 8th Grade Proficiency Arizona 15 21 California 11 18 Hawaii 16 16 Montana 22 37 New Mexico 13 13 Oregon 21 32 Utah 23 26 Wyoming 19 25 Construct a scatterplot and comment on any interesting characteristics Find the least squares equation. If Nevada had a 4th grade proficiency of 14%, what would you expect the 8th grade proficiency to be?In a study of the causes of bearing wear, a machine was run 24 times, with various loads (denoted x1), oil viscosities (x2), and ambient temperatures (x3). The wear, denoted y, was modeled as y = β0 + β1x1 + β2x2 + β3x3 + ε. When this model was fit to the data, the sum of squares for error was SSE = 9.37. Then the reduced model y = β0 + β1x1 + β2x2 + β3x3 was fit, and the sum of squares for error was SSE = 27.49. Is it reasonable to use the reduced model, rather than the model containing all the interactions, to predict wear? Explain.Find the best-fitting least-squares linear and quadratic approximations to the data set{(1,2),(3,4),(5,7),(7,9),(9,12)}.
- When a least squares line is fit to the 12 observations in the labor cost data, we obtain SSE =656, 214.3589. Calculate s2 and s (isnt n-k-1)?Let x be the number of different research programs, and let y be the mean number of patents per program. As in any business, a company can spread itself too thin. For example, too many research programs might lead to a decline in overall research productivity. The following data are for a collection of pharmaceutical companies and their research programs. x 10 12 14 16 18 20 y 1.7 1.6 1.6 1.4 1.0 0.7 (c) Find x, and y. Then find the equation of the least-squares line = a + bx. (Round your answers for x and y to two decimal places. Round your answers for a and b to three decimal places.) x =? y =? = ?+ ?x (f) Suppose a pharmaceutical company has 12 different research programs. What does the least-squares equation forecast for y = mean number of patents per program? (Round your answer to two decimal places.) ? patents per programSuppose a doctor measures the height, x, and head circumference, y, of 8 children and obtains the data below. Thecorrelation coefficient is 0.944 and the least squares regression line is y = 0.199x + 11.982. Complete parts (a) and (b)below.Height, x27.5 25.5 26.25 25.25 27.5 26.25 26 27.25 27.25 27 27.25 ФHead Circumference, # 17.5 17.0 17.2 17.0 17.5 17.3 17.2 17.4 17.3 17.3 17.4(a) Compute the coefficient of determination, R?R?.% (Round to one decimal place as needed.)(b) Interpret the coefficient of determination and comment on the adequacy of the linear model.Approximately % of the variation inis explained by the least-squares regression model.According to the residual plot, the linear model appears to be (Round to one decimal place as needed.)
- The accompanying table is used to make the preliminary computations forfinding the least squares line for the given pairs of x and y values.When using the least-squares line for prediction, are results more reliable for extrapolation or interpolation? a. Interpolation, because we are predicting from data outside the range used to create the least-squares line. b. Extrapolation, because we are predicting from data outside the range used to create the least-squares line. c. Extrapolation, because we are predicting from data in the range used to create the least-squares line. d. Interpolation, because we are predicting from data in the range used to create the least-squares line.Find the curve of best-fit y = axb to the following data by using the method of least square.