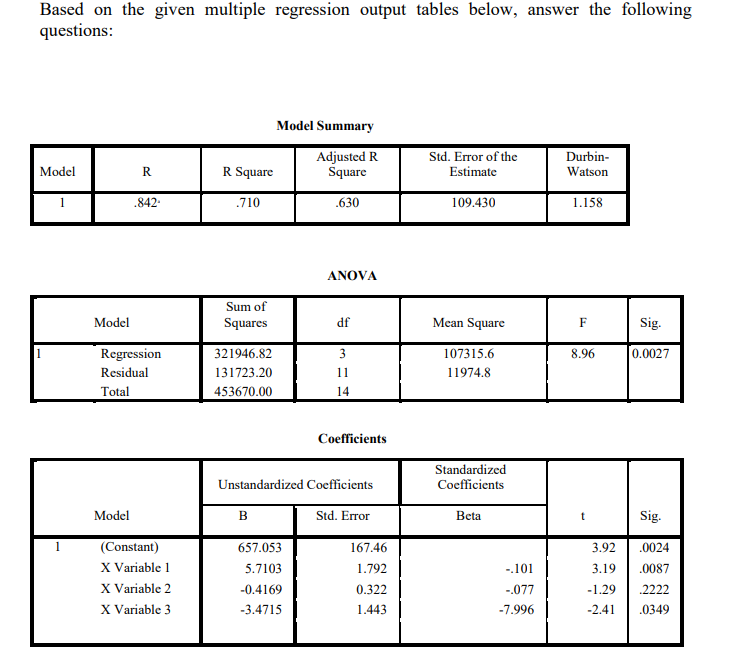
gression following questions: Model Summary Adjusted R Square Std. Error of the Durbin- Model R R Square Estimate Watson .842. .710 .630 109.430 1.158 ΑNOVA Sum of Squares Model JP Mean Square F Sig. Regression 321946.82 3 107315.6 8.96 0.0027 Residual 131723.20 11 11974.8 Total 453670.00 14 Coefficients Standardized Coefficients Unstandardized Coefficients Model в Std. Error Beta Sig. (Constant) X Variable 1 X Variable 2 X Variable 3 657.053 167.46 3.92 .0024 5.7103 1.792 -.101 3.19 .0087 -0.4169 0.322 -.077 -1.29 2222 -3.4715 1.443 -7.996 -2.41 .0349

MATLAB: An Introduction with Applications
6th Edition
ISBN:9781119256830
Author:Amos Gilat
Publisher:Amos Gilat
Chapter1: Starting With Matlab
Section: Chapter Questions
Problem 1P
icon
Related questions
icon
Concept explainers
Question

At α-value=0.01, test whether there is a significant relationship between the
dependent variable (Y) and the independent variables (X1, X2 and X3).

Based on the given multiple regression output tables below, answer the following
questions:
Model Summary
Adjusted R
Square
Std. Error of the
Estimate
Durbin-
Model
R
R Square
Watson
1
.842.
.710
.630
109.430
1.158
ANOVA
Sum of
Squares
Model
df
Mean Square
F
Sig.
Regression
321946.82
3
107315.6
8.96
0.0027
Residual
131723.20
11
11974.8
Total
453670.00
14
Coefficients
Standardized
Coefficients
Unstandardized Coefficients
Model
B
Std. Error
Beta
Sig.
(Constant)
657.053
167.46
3.92
.0024
X Variable 1
X Variable 2
X Variable 3
5.7103
1.792
-.101
3.19
.0087
-0.4169
0.322
-.077
-1.29
.2222
-3.4715
1.443
-7.996
-2.41
.0349
Transcribed Image Text:Based on the given multiple regression output tables below, answer the following questions: Model Summary Adjusted R Square Std. Error of the Estimate Durbin- Model R R Square Watson 1 .842. .710 .630 109.430 1.158 ANOVA Sum of Squares Model df Mean Square F Sig. Regression 321946.82 3 107315.6 8.96 0.0027 Residual 131723.20 11 11974.8 Total 453670.00 14 Coefficients Standardized Coefficients Unstandardized Coefficients Model B Std. Error Beta Sig. (Constant) 657.053 167.46 3.92 .0024 X Variable 1 X Variable 2 X Variable 3 5.7103 1.792 -.101 3.19 .0087 -0.4169 0.322 -.077 -1.29 .2222 -3.4715 1.443 -7.996 -2.41 .0349
Expert Solution
steps

Step by step

Solved in 2 steps

Blurred answer
Knowledge Booster
Correlation, Regression, and Association
Learn more about
Need a deep-dive on the concept behind this application? Look no further. Learn more about this topic, statistics and related others by exploring similar questions and additional content below.
Similar questions
  • SEE MORE QUESTIONS
Recommended textbooks for you
MATLAB: An Introduction with Applications
Statistics
ISBN:
9781119256830
Author:
Amos Gilat
Publisher:
John Wiley & Sons Inc
Probability and Statistics for Engineering and th…
Statistics
ISBN:
9781305251809
Author:
Jay L. Devore
Publisher:
Cengage Learning
Statistics for The Behavioral Sciences (MindTap C…
Statistics
ISBN:
9781305504912
Author:
Frederick J Gravetter, Larry B. Wallnau
Publisher:
Cengage Learning
Elementary Statistics: Picturing the World (7th E…
Statistics
ISBN:
9780134683416
Author:
Ron Larson, Betsy Farber
Publisher:
PEARSON
The Basic Practice of Statistics
Statistics
ISBN:
9781319042578
Author:
David S. Moore, William I. Notz, Michael A. Fligner
Publisher:
W. H. Freeman
Introduction to the Practice of Statistics
Statistics
ISBN:
9781319013387
Author:
David S. Moore, George P. McCabe, Bruce A. Craig
Publisher:
W. H. Freeman