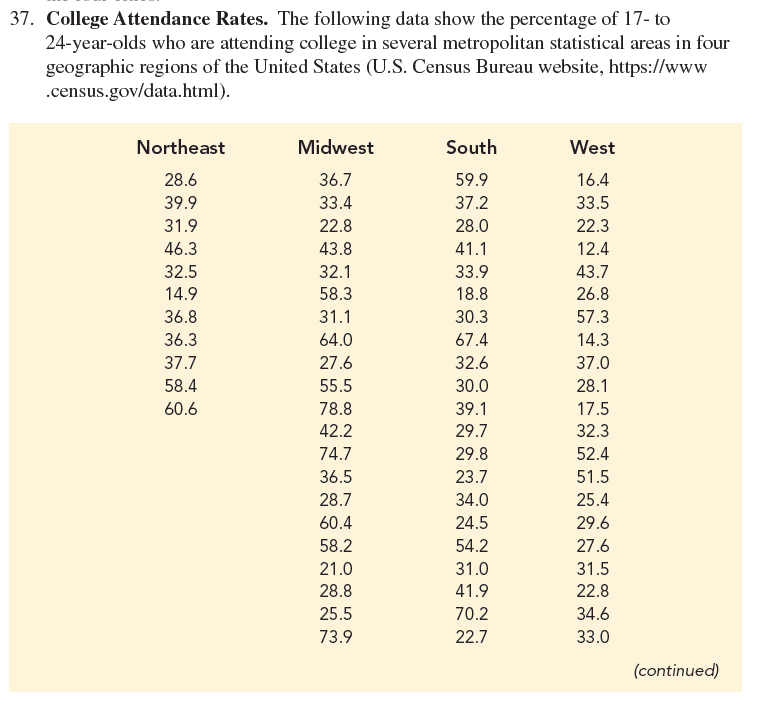
37. College Attendance Rates. The following data show the percentage of 17- to 24-year-olds who are attending college in several metropolitan statistical areas in four geographic regions of the United States (U.S. Census Bureau website, https://www .census.gov/data.html). Northeast Midwest South West 28.6 36.7 59.9 16.4 39.9 33.4 37.2 33.5 31.9 22.8 28.0 22.3 46.3 43.8 41.1 12.4 32.5 32.1 33.9 43.7 14.9 58.3 18.8 26.8 36.8 31.1 30.3 57.3 36.3 64.0 67.4 14.3 37.7 27.6 32.6 37.0 58.4 55.5 30.0 28.1 60.6 78.8 39.1 17.5 42.2 29.7 32.3 74.7 29.8 52.4 36.5 28.7 23.7 51.5 34.0 25.4 60.4 24.5 29.6 58.2 54.2 27.6 21.0 28.8 31.0 31.5 41.9 22.8 25.5 70.2 34.6 73.9 22.7 33.0 (continued)
37. College Attendance Rates. The following data show the percentage of 17- to 24-year-olds who are attending college in several metropolitan statistical areas in four geographic regions of the United States (U.S. Census Bureau website, https://www .census.gov/data.html). Northeast Midwest South West 28.6 36.7 59.9 16.4 39.9 33.4 37.2 33.5 31.9 22.8 28.0 22.3 46.3 43.8 41.1 12.4 32.5 32.1 33.9 43.7 14.9 58.3 18.8 26.8 36.8 31.1 30.3 57.3 36.3 64.0 67.4 14.3 37.7 27.6 32.6 37.0 58.4 55.5 30.0 28.1 60.6 78.8 39.1 17.5 42.2 29.7 32.3 74.7 29.8 52.4 36.5 28.7 23.7 51.5 34.0 25.4 60.4 24.5 29.6 58.2 54.2 27.6 21.0 28.8 31.0 31.5 41.9 22.8 25.5 70.2 34.6 73.9 22.7 33.0 (continued)

MATLAB: An Introduction with Applications
6th Edition
ISBN:9781119256830
Author:Amos Gilat
Publisher:Amos Gilat
Chapter1: Starting With Matlab
Section: Chapter Questions
Problem 1P

Related questions
Question
The following data show the percentage of 17 to 24 year olds who are attending college in several metropolitan statistical areas in four geographic regions of the united states (U.S. Census Bureau website, April 2015)
Transcribed Image Text:37. College Attendance Rates. The following data show the percentage of 17- to
24-year-olds who are attending college in several metropolitan statistical areas in four
geographic regions of the United States (U.S. Census Bureau website, https://www
.census.gov/data.html).
Northeast
Midwest
South
West
28.6
36.7
59.9
16.4
39.9
33.4
37.2
33.5
31.9
22.8
28.0
22.3
46.3
43.8
41.1
12.4
32.5
32.1
33.9
43.7
14.9
58.3
18.8
26.8
36.8
31.1
30.3
57.3
36.3
64.0
67.4
14.3
37.7
27.6
32.6
37.0
58.4
55.5
30.0
28.1
60.6
78.8
39.1
17.5
42.2
29.7
32.3
74.7
29.8
52.4
36.5
23.7
51.5
28.7
34.0
25.4
60.4
24.5
29.6
58.2
54.2
27.6
21.0
31.0
31.5
28.8
41.9
22.8
25.5
70.2
34.6
73.9
22.7
33.0
(continued)
Transcribed Image Text:Northeast
Midwest
South
West
36.8
30.7
37.0
28.4
30.8
33.8
27.2
21.6
28.7
31.8
31.5
21.8
56.8
38.2
28.3
40.2
33.3
35.4
39.4
21.6
39.2
35.5
26.1
32.7
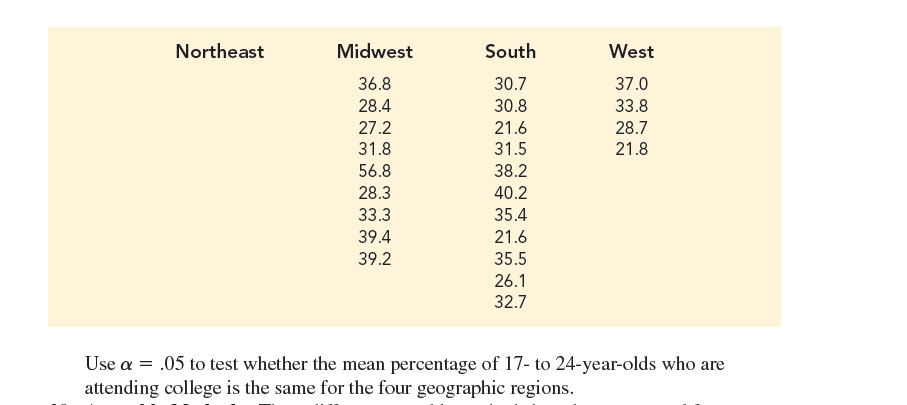
Use a = .05 to test whether the mean percentage of 17- to 24-year-olds who are
attending college is the same for the four geographic regions.
Expert Solution
This question has been solved!
Explore an expertly crafted, step-by-step solution for a thorough understanding of key concepts.

This is a popular solution!

Trending now
This is a popular solution!

Step by step
Solved in 2 steps with 2 images

Knowledge Booster


Learn more about
Need a deep-dive on the concept behind this application? Look no further. Learn more about this topic, statistics and related others by exploring similar questions and additional content below.Recommended textbooks for you
MATLAB: An Introduction with Applications
Statistics
ISBN:
9781119256830
Author:
Amos Gilat
Publisher:
John Wiley & Sons Inc

Probability and Statistics for Engineering and th…
Statistics
ISBN:
9781305251809
Author:
Jay L. Devore
Publisher:
Cengage Learning

Statistics for The Behavioral Sciences (MindTap C…
Statistics
ISBN:
9781305504912
Author:
Frederick J Gravetter, Larry B. Wallnau
Publisher:
Cengage Learning
MATLAB: An Introduction with Applications
Statistics
ISBN:
9781119256830
Author:
Amos Gilat
Publisher:
John Wiley & Sons Inc
Probability and Statistics for Engineering and th…
Statistics
ISBN:
9781305251809
Author:
Jay L. Devore
Publisher:
Cengage Learning
Statistics for The Behavioral Sciences (MindTap C…
Statistics
ISBN:
9781305504912
Author:
Frederick J Gravetter, Larry B. Wallnau
Publisher:
Cengage Learning

Elementary Statistics: Picturing the World (7th E…
Statistics
ISBN:
9780134683416
Author:
Ron Larson, Betsy Farber
Publisher:
PEARSON

The Basic Practice of Statistics
Statistics
ISBN:
9781319042578
Author:
David S. Moore, William I. Notz, Michael A. Fligner
Publisher:
W. H. Freeman

Introduction to the Practice of Statistics
Statistics
ISBN:
9781319013387
Author:
David S. Moore, George P. McCabe, Bruce A. Craig
Publisher:
W. H. Freeman