A study of emergency service facilities investigated the relationship between the number of facilities and the average distance traveled to provide the emergency service. The following table gives the data collected. Number of Facilities Average Distance (miles) 9 1.66 11 1.13 16 0.83 21 0.61 27 0.51 30 0.46 2. .Does a simple linear regression model appear to be appropriate? Explain. a.No, the scatter diagram suggests that there is no relationship. b.No, the scatter diagram suggests that there is a curvilinear relationship. c.Yes, the scatter diagram suggests that there is a linear relationship. 3.Develop an estimated regression equation for the data corresponding to a second-order model with one predictor variable. (Round your numerical values to four decimal places.)


Correlation
Correlation defines a relationship between two independent variables. It tells the degree to which variables move in relation to each other. When two sets of data are related to each other, there is a correlation between them.
Linear Correlation
A correlation is used to determine the relationships between numerical and categorical variables. In other words, it is an indicator of how things are connected to one another. The correlation analysis is the study of how variables are related.
Regression Analysis
Regression analysis is a statistical method in which it estimates the relationship between a dependent variable and one or more independent variable. In simple terms dependent variable is called as outcome variable and independent variable is called as predictors. Regression analysis is one of the methods to find the trends in data. The independent variable used in Regression analysis is named Predictor variable. It offers data of an associated dependent variable regarding a particular outcome.
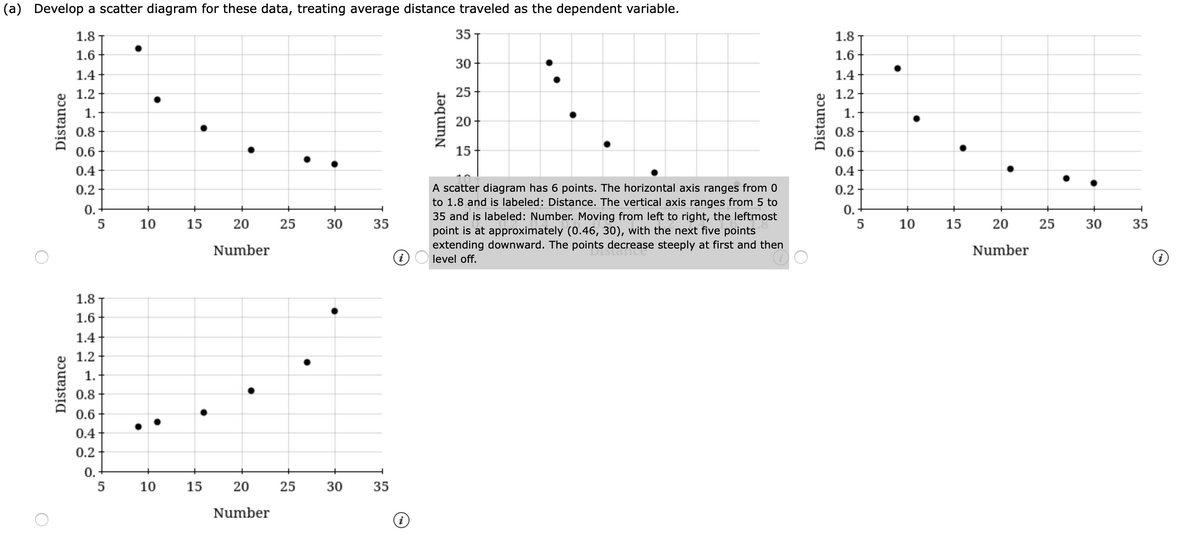
A study of emergency service facilities investigated the relationship between the number of facilities and the average distance traveled to provide the emergency service. The following table gives the data collected.
| Number of Facilities |
Average Distance (miles) |
|---|---|
| 9 | 1.66 |
| 11 | 1.13 |
| 16 | 0.83 |
| 21 | 0.61 |
| 27 | 0.51 |
| 30 | 0.46 |
2. .Does a simple linear regression model appear to be appropriate? Explain.
a.No, the
b.No, the scatter diagram suggests that there is a curvilinear relationship.
c.Yes, the scatter diagram suggests that there is a linear relationship.
3.Develop an estimated regression equation for the data corresponding to a second-order model with one predictor variable. (Round your numerical values to four decimal places.)


Trending now
This is a popular solution!

Step by step
Solved in 2 steps with 3 images


