.) An investigator is predicting systolic blood pressure by minutes of moderate exercise. If the regression line is Y = 130 – 0.5* X. What will be the difference of systolic blood pressure for a person that did 30 minutes of moderate exercise and a person that did 40 minutes of moderate exercise? 115 10 120 5


Correlation
Correlation defines a relationship between two independent variables. It tells the degree to which variables move in relation to each other. When two sets of data are related to each other, there is a correlation between them.
Linear Correlation
A correlation is used to determine the relationships between numerical and categorical variables. In other words, it is an indicator of how things are connected to one another. The correlation analysis is the study of how variables are related.
Regression Analysis
Regression analysis is a statistical method in which it estimates the relationship between a dependent variable and one or more independent variable. In simple terms dependent variable is called as outcome variable and independent variable is called as predictors. Regression analysis is one of the methods to find the trends in data. The independent variable used in Regression analysis is named Predictor variable. It offers data of an associated dependent variable regarding a particular outcome.
Please answer both multiple choice questions.
a.) An investigator is predicting systolic blood pressure by minutes of moderate exercise. If the regression line is Y = 130 – 0.5* X. What will be the difference of systolic blood pressure for a person that did 30 minutes of moderate exercise and a person that did 40 minutes of moderate exercise?
- 115
- 10
- 120
- 5
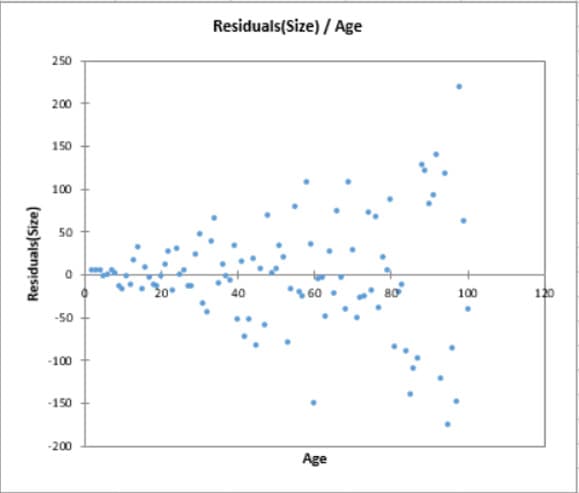
b.) According to the picture attached of the resdiual plot, pelase select the statement that is true.
- All the assumptions are met.
- There is problem of heteroscedasticity.
- There is problem of collinearity.
- We should include higher order terms.


Trending now
This is a popular solution!

Step by step
Solved in 2 steps with 1 images


