. Conduct t-tests on each of the beta parameters. What is your conclusion in each case? 1. What percentage of the variation in the price is explained by these independent variables'
. Conduct t-tests on each of the beta parameters. What is your conclusion in each case? 1. What percentage of the variation in the price is explained by these independent variables'

Functions and Change: A Modeling Approach to College Algebra (MindTap Course List)
6th Edition
ISBN:9781337111348
Author:Bruce Crauder, Benny Evans, Alan Noell
Publisher:Bruce Crauder, Benny Evans, Alan Noell
Chapter3: Straight Lines And Linear Functions
Section3.CR: Chapter Review Exercises
Problem 15CR: Life Expectancy The following table shows the average life expectancy, in years, of a child born in...

Related questions
Question
c and d
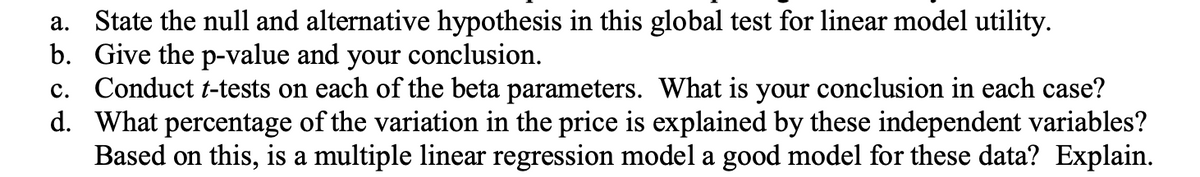
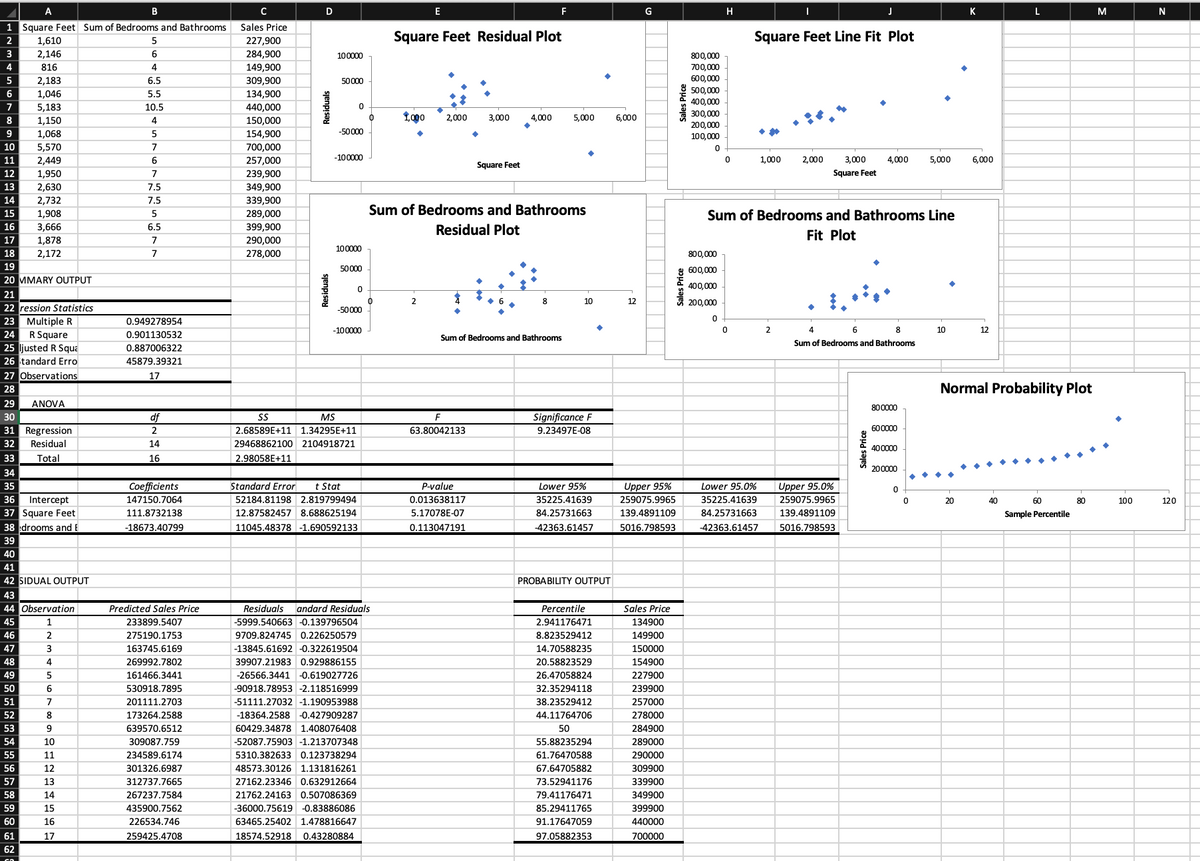
Transcribed Image Text:a. State the null and alternative hypothesis in this global test for linear model utility.
b. Give the p-value and your conclusion.
c. Conduct t-tests on each of the beta parameters. What is your conclusion in each case?
d. What percentage of the variation in the price is explained by these independent variables?
Based on this, is a multiple linear regression model a good model for these data? Explain.
Transcribed Image Text:B
F
G
K
M
N
1 Square Feet Sum of Bedrooms and Bathrooms
Sales Price
Square Feet Residual Plot
Square Feet Line Fit Plot
2
1,610
227,900
284,900
149,900
3
2,146
100000
800,000
4
816
4
700.000
5
2,183
6.5
309,900
50000
600,000
500.000
6
1,046
5.5
134,900
400,000
5,183
1,150
10.5
440,000
L,000
300,000
8
4
150,000
2,000
3,000
4,000
5,000
6.000
200,000
-50000
154,900
700,000
9
1,068
5
100,000
10
5,570
11
2,449
6
257,000
-100000
1,000
2,000
3,000
4,000
5,000
6,000
Square Feet
12
1,950
239,900
Square Feet
2,630
2,732
13
7.5
349,900
14
7.5
339,900
Sum of Bedrooms and Bathrooms
Sum of Bedrooms and Bathrooms Line
15
1,908
289,000
16
3,666
6.5
399,900
Residual Plot
Fit Plot
17
1,878
7
290,000
100000
18
2,172
7
278,000
800,000
19
50000
600,000
20 MMARY OUTPUT
400,000
21
8
10
12
200,000
ression Statistics
23 Multiple R
-50000
0.949278954
-100000
2
4
6
10
12
R Square
25 ljusted R Squa
26 tandard Erro
27 Observations
24
0.901130532
Sum of Bedrooms and Bathrooms
Sum of Bedrooms and Bathrooms
0.887006322
45879.39321
17
Normal Probability Plot
28
29
ANOVA
800000
30
df
SS
MS
Significance F
31 Regression
2
2.68589E+11
1.34295E+11
63.80042133
9.23497E-08
600000
32
Residual
14
29468862100 2104918721
400000
33
Total
16
2.98058E+11
200000
34
Upper 95%
259075.9965
Lower 95%
Coefficients
147150.7064
35
Standard Error
t Stat
P-value
Lower 95.0%
Upper 95.0%
36
Intercept
52184.81198 2.819799494
0.013638117
35225.41639
35225.41639
259075.9965
20
40
60
80
100
120
37 Square Feet
38 drooms and E
111.8732138
12.87582457 8.688625194
5.17078E-07
84.25731663
139.4891109
84.25731663
139.4891109
Sample Percentile
-18673.40799
11045.48378 -1.690592133
0.113047191
-42363.61457
5016.798593
-42363.61457
5016.798593
39
40
41
42 SIDUAL OUTPUT
PROBABILITY OUTPUT
43
44 Observation
Predicted Sales Price
Residuals
andard Residuals
Percentile
Sales Price
45
1
233899.5407
-5999.540663 -0.139796504
2.941176471
134900
46
2
275190.1753
9709.824745 0.226250579
8.823529412
149900
47
3
163745.6169
-13845.61692 -0.322619504
14.70588235
150000
48
4
269992.7802
39907.21983 0.929886155
20.58823529
154900
49
5
161466.3441
-26566.3441 -0.619027726
26.47058824
227900
50
6
530918.7895
-90918.78953 -2.118516999
32.35294118
239900
51
7
201111.2703
-51111.27032 -1.190953988
38.23529412
257000
52
8
173264.2588
-18364.2588 -0.427909287
44.11764706
278000
53
9
639570.6512
60429.34878 1.408076408
50
284900
54
10
309087.759
-52087.75903 -1.213707348
55.88235294
289000
55
11
234589.6174
5310.382633 0.123738294
61.76470588
290000
56
12
301326.6987
48573.30126
1.131816261
67.64705882
309900
57
13
312737.7665
27162.23346 0.632912664
73.52941176
339900
58
14
267237.7584
21762.24163 0.507086369
79.41176471
349900
59
15
435900.7562
-36000.75619 -0.83886086
85.29411765
399900
60
16
226534.746
63465.25402 1.478816647
91.17647059
440000
61
17
259425.4708
18574.52918 0.43280884
97.05882353
700000
62
Residuals
Sales Price
Sales Price
Sales Price
Expert Solution
This question has been solved!
Explore an expertly crafted, step-by-step solution for a thorough understanding of key concepts.

This is a popular solution!

Trending now
This is a popular solution!

Step by step
Solved in 2 steps

Recommended textbooks for you
Functions and Change: A Modeling Approach to Coll…
Algebra
ISBN:
9781337111348
Author:
Bruce Crauder, Benny Evans, Alan Noell
Publisher:
Cengage Learning

Glencoe Algebra 1, Student Edition, 9780079039897…
Algebra
ISBN:
9780079039897
Author:
Carter
Publisher:
McGraw Hill

Functions and Change: A Modeling Approach to Coll…
Algebra
ISBN:
9781337111348
Author:
Bruce Crauder, Benny Evans, Alan Noell
Publisher:
Cengage Learning
Glencoe Algebra 1, Student Edition, 9780079039897…
Algebra
ISBN:
9780079039897
Author:
Carter
Publisher:
McGraw Hill

Algebra & Trigonometry with Analytic Geometry
Algebra
ISBN:
9781133382119
Author:
Swokowski
Publisher:
Cengage

College Algebra
Algebra
ISBN:
9781305115545
Author:
James Stewart, Lothar Redlin, Saleem Watson
Publisher:
Cengage Learning

Algebra and Trigonometry (MindTap Course List)
Algebra
ISBN:
9781305071742
Author:
James Stewart, Lothar Redlin, Saleem Watson
Publisher:
Cengage Learning