Consider the following scatter diagram: 25 20 15 10 Initial Which of the following best describes the relationship between the initial and final temperatures? Select one: a. A positive linear relationship, with r close to 1, Ob. A positive, linear relationship, with r close to 0. O . A negative, linear relationship, with r close to -1. O . No linear relationship, with r approximately equal to 0, Final
Consider the following scatter diagram: 25 20 15 10 Initial Which of the following best describes the relationship between the initial and final temperatures? Select one: a. A positive linear relationship, with r close to 1, Ob. A positive, linear relationship, with r close to 0. O . A negative, linear relationship, with r close to -1. O . No linear relationship, with r approximately equal to 0, Final

Algebra & Trigonometry with Analytic Geometry
13th Edition
ISBN:9781133382119
Author:Swokowski
Publisher:Swokowski
Chapter7: Analytic Trigonometry
Section7.6: The Inverse Trigonometric Functions
Problem 94E

Related questions
Topic Video
Question
q26
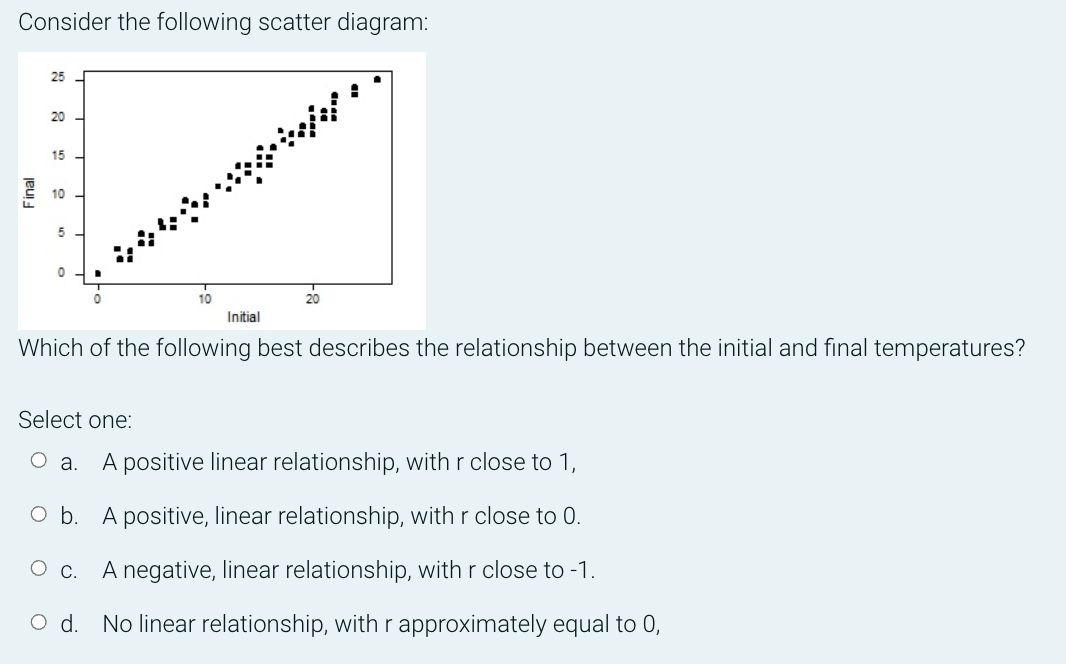
Transcribed Image Text:Consider the following scatter diagram:
25
20
15
10
5
10
Initial
Which of the following best describes the relationship between the initial and final temperatures?
Select one:
O .
A positive linear relationship, with r close to 1,
Ob.
A positive, linear relationship, with r close to 0.
A negative, linear relationship, with r close to -1.
Ос.
O d.
No linear relationship, with r approximately equal to 0,
Final
Expert Solution
This question has been solved!
Explore an expertly crafted, step-by-step solution for a thorough understanding of key concepts.

This is a popular solution!

Trending now
This is a popular solution!

Step by step
Solved in 2 steps

Knowledge Booster


Learn more about
Need a deep-dive on the concept behind this application? Look no further. Learn more about this topic, statistics and related others by exploring similar questions and additional content below.Recommended textbooks for you
Algebra & Trigonometry with Analytic Geometry
Algebra
ISBN:
9781133382119
Author:
Swokowski
Publisher:
Cengage

Functions and Change: A Modeling Approach to Coll…
Algebra
ISBN:
9781337111348
Author:
Bruce Crauder, Benny Evans, Alan Noell
Publisher:
Cengage Learning
Algebra & Trigonometry with Analytic Geometry
Algebra
ISBN:
9781133382119
Author:
Swokowski
Publisher:
Cengage
Functions and Change: A Modeling Approach to Coll…
Algebra
ISBN:
9781337111348
Author:
Bruce Crauder, Benny Evans, Alan Noell
Publisher:
Cengage Learning