The following table displays the mathematics test scores for a random sample of college students, along with their final SY16C grades. a. Fit the regression line y = a+bx to the data and interpret the results. b. Use the regression equation to determine the SY16C grade for a college student who scored 60 on their achievement test. What would their SY16C grade be? Mathematics test (x) SY16C grades (y) 1 39 65 43 78 21 52 4 64 82 57 92 47 89 7 28 73 75 98 9. 34 56 2. 6.
The following table displays the mathematics test scores for a random sample of college students, along with their final SY16C grades. a. Fit the regression line y = a+bx to the data and interpret the results. b. Use the regression equation to determine the SY16C grade for a college student who scored 60 on their achievement test. What would their SY16C grade be? Mathematics test (x) SY16C grades (y) 1 39 65 43 78 21 52 4 64 82 57 92 47 89 7 28 73 75 98 9. 34 56 2. 6.

Functions and Change: A Modeling Approach to College Algebra (MindTap Course List)
6th Edition
ISBN:9781337111348
Author:Bruce Crauder, Benny Evans, Alan Noell
Publisher:Bruce Crauder, Benny Evans, Alan Noell
Chapter5: A Survey Of Other Common Functions
Section5.6: Higher-degree Polynomials And Rational Functions
Problem 1TU: The following fictitious table shows kryptonite price, in dollar per gram, t years after 2006. t=...

Related questions
Question
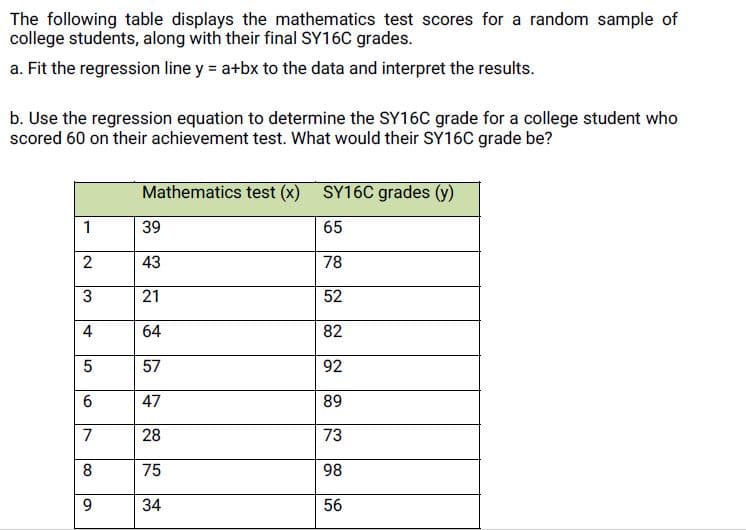
Transcribed Image Text:The following table displays the mathematics test scores for a random sample of
college students, along with their final SY16C grades.
a. Fit the regression line y = a+bx to the data and interpret the results.
b. Use the regression equation to determine the SY16C grade for a college student who
scored 60 on their achievement test. What would their SY16C grade be?
Mathematics test (x) SY16C grades (y)
1
39
65
43
78
3
21
52
4
64
82
57
92
47
89
7
28
73
8
75
98
9.
34
56
2.
Expert Solution
This question has been solved!
Explore an expertly crafted, step-by-step solution for a thorough understanding of key concepts.

Step by step
Solved in 3 steps with 3 images

Recommended textbooks for you
Functions and Change: A Modeling Approach to Coll…
Algebra
ISBN:
9781337111348
Author:
Bruce Crauder, Benny Evans, Alan Noell
Publisher:
Cengage Learning

Algebra & Trigonometry with Analytic Geometry
Algebra
ISBN:
9781133382119
Author:
Swokowski
Publisher:
Cengage
Functions and Change: A Modeling Approach to Coll…
Algebra
ISBN:
9781337111348
Author:
Bruce Crauder, Benny Evans, Alan Noell
Publisher:
Cengage Learning
Algebra & Trigonometry with Analytic Geometry
Algebra
ISBN:
9781133382119
Author:
Swokowski
Publisher:
Cengage