0.5, so it is reasonable n in that case. Certainly a correction of 0.5, as by some, is entirely too large and results in a worse estimate of the true probability in most cases. See Pearson (1947), Plackett (1964), Grizzle (1967) and Conover (1974) for support of this statement. More information on the recomme Mantel-Haenszel test may be found in Li, Simon, and Gart (1997) and Breslow and Liang (1982). D Confidence intervals may be formed for any unknown probabilities associ- ated with the 2 X 2 contingency table or any contingency table, for that matter, by applying the procedure described in Section 3.1. Similarly, the test in Section 3.1 may be used on contingency tables, whenever the hypotheses are pertinent and the assumptions of the test are met A shortcut rule for the one-sided test is given by Ott and Free (1969). Further discussion of the continuity correction may be found in Mantel and Greenhouse (1968), Pirie and Hamdan (1972), and Maxwell (1976). The power of the test 1s discussed by Harkness and Katz (1964). The exact test is considered by Gail and Gart (1973), Garside and Mack (1976), and McDonald, Davis, and Milliken (1977). For methods of combining the test statistics in several 2 x 2 contingency tables see Radhakrishna (1965), Nelson (1966), Meeker (1978), and Zelen (1971). Possible errors in the marginal totals because of misclassification is the subject of many papers, including ones by Chiacchierini and Arnold (1977) and Plackett (1977). Other related papers are by Fienberg and Gilbert (1970), Upton and Lee (1976), and Ray (1976). An excellent book by Fleiss (1973) is concerned primarily with discussion of 2 X 2 contingency tables. KERCISES A random sample of 135 people was drawn from each of two populations to gauge reaction to pending legislation. In the first sample there were 43 responses of "opposed'"; in the second sample there were 37 "opposed." Is there a difference in the proportion of people opposed in the two populations? Does a comparison of this problem with Exercises 1 and in Section 3.5 suggest an advantage in using the same persons in both samples whenever possible, such as in a "before" and "after" situation? 1. Sixty students were divided into two classes of 30 each and taught how to write a program for a computer. One class used the conventional method of learning, and the other class used a new, experimental method. At the end of the courses, each student was given a test that consisted of writing a computer program. The program was either correct or incorrect, and the results were tabulated as follows. 2. CONTINGENCY TABLES Incorrect Correct fo 10 isv insltib elsto Program o Program 7 23 Conventional Class 27 Experimental Class Ms timo of Is there reason to believe the experimental method is superior? Or could the preceding differences be due to chance fluctuations? One hundred men and 100 women were asked to try a new toothpaste and to state whether they liked or did not like the new taste. Thirty-two men and 26 women said they did not like the new taste. Does this indicate a difference in preferences between men and women in general? 3. 4. Contingency tables may be used to present data representing scales of measurement higher than the nominal scale. For example, a random sample of size 20 was selected from the graduate students who are U.S. citizens, and their grade poirnt averages were recorded. 3.42 3.54 3.21 3.63 3.22 3.80 3.70 3.20 3.75 3.31 3.86 4.00 2.86 2.92 3.59 2.91 3.77 2.70 3.06 3.30 LE Also, a random sample of 20 students was selected from the non-U.S. citizen group graduate students at the same university. Their grade point averages were as follows. of 3.50 4.00 3.43 3.85 3.84 3.21 3.58 3.94 3.48 3.76 3.87 2.93 4.00 3.37 3.72 4.00 3.06 3.92 3.72 3.91 Test the null hypothesis that the proportion of graduate students with averagos of 3.50 o higher is the same for both the U.S. citizens and the Fiaha 5 n
0.5, so it is reasonable n in that case. Certainly a correction of 0.5, as by some, is entirely too large and results in a worse estimate of the true probability in most cases. See Pearson (1947), Plackett (1964), Grizzle (1967) and Conover (1974) for support of this statement. More information on the recomme Mantel-Haenszel test may be found in Li, Simon, and Gart (1997) and Breslow and Liang (1982). D Confidence intervals may be formed for any unknown probabilities associ- ated with the 2 X 2 contingency table or any contingency table, for that matter, by applying the procedure described in Section 3.1. Similarly, the test in Section 3.1 may be used on contingency tables, whenever the hypotheses are pertinent and the assumptions of the test are met A shortcut rule for the one-sided test is given by Ott and Free (1969). Further discussion of the continuity correction may be found in Mantel and Greenhouse (1968), Pirie and Hamdan (1972), and Maxwell (1976). The power of the test 1s discussed by Harkness and Katz (1964). The exact test is considered by Gail and Gart (1973), Garside and Mack (1976), and McDonald, Davis, and Milliken (1977). For methods of combining the test statistics in several 2 x 2 contingency tables see Radhakrishna (1965), Nelson (1966), Meeker (1978), and Zelen (1971). Possible errors in the marginal totals because of misclassification is the subject of many papers, including ones by Chiacchierini and Arnold (1977) and Plackett (1977). Other related papers are by Fienberg and Gilbert (1970), Upton and Lee (1976), and Ray (1976). An excellent book by Fleiss (1973) is concerned primarily with discussion of 2 X 2 contingency tables. KERCISES A random sample of 135 people was drawn from each of two populations to gauge reaction to pending legislation. In the first sample there were 43 responses of "opposed'"; in the second sample there were 37 "opposed." Is there a difference in the proportion of people opposed in the two populations? Does a comparison of this problem with Exercises 1 and in Section 3.5 suggest an advantage in using the same persons in both samples whenever possible, such as in a "before" and "after" situation? 1. Sixty students were divided into two classes of 30 each and taught how to write a program for a computer. One class used the conventional method of learning, and the other class used a new, experimental method. At the end of the courses, each student was given a test that consisted of writing a computer program. The program was either correct or incorrect, and the results were tabulated as follows. 2. CONTINGENCY TABLES Incorrect Correct fo 10 isv insltib elsto Program o Program 7 23 Conventional Class 27 Experimental Class Ms timo of Is there reason to believe the experimental method is superior? Or could the preceding differences be due to chance fluctuations? One hundred men and 100 women were asked to try a new toothpaste and to state whether they liked or did not like the new taste. Thirty-two men and 26 women said they did not like the new taste. Does this indicate a difference in preferences between men and women in general? 3. 4. Contingency tables may be used to present data representing scales of measurement higher than the nominal scale. For example, a random sample of size 20 was selected from the graduate students who are U.S. citizens, and their grade poirnt averages were recorded. 3.42 3.54 3.21 3.63 3.22 3.80 3.70 3.20 3.75 3.31 3.86 4.00 2.86 2.92 3.59 2.91 3.77 2.70 3.06 3.30 LE Also, a random sample of 20 students was selected from the non-U.S. citizen group graduate students at the same university. Their grade point averages were as follows. of 3.50 4.00 3.43 3.85 3.84 3.21 3.58 3.94 3.48 3.76 3.87 2.93 4.00 3.37 3.72 4.00 3.06 3.92 3.72 3.91 Test the null hypothesis that the proportion of graduate students with averagos of 3.50 o higher is the same for both the U.S. citizens and the Fiaha 5 n

College Algebra
7th Edition
ISBN:9781305115545
Author:James Stewart, Lothar Redlin, Saleem Watson
Publisher:James Stewart, Lothar Redlin, Saleem Watson
Chapter9: Counting And Probability
Section9.2: Probability
Problem 32E: Two balls are drawn at random from the jar. Find the following conditional probabilities. (a) The...

Related questions

Topic Video
Question
Question 2the top part of the second image is the continuation of question 2.
Transcribed Image Text:0.5, so it is reasonable
n in that case. Certainly a correction of 0.5, as
by some, is entirely too large and results in a worse estimate of
the true probability in most cases. See Pearson (1947), Plackett (1964), Grizzle
(1967) and Conover (1974) for support of this statement. More information on the
recomme
Mantel-Haenszel test may be found in Li, Simon, and Gart (1997) and Breslow
and Liang (1982). D
Confidence intervals may be formed for any unknown probabilities associ-
ated with the 2 X 2 contingency table or any contingency table, for that matter,
by applying the procedure described in Section 3.1. Similarly, the test in Section
3.1 may be used on contingency tables, whenever the hypotheses are pertinent
and the assumptions of the test are met
A shortcut rule for the one-sided test is given by Ott and Free (1969). Further
discussion of the continuity correction may be found in Mantel and Greenhouse
(1968), Pirie and Hamdan (1972), and Maxwell (1976). The power of the test 1s
discussed by Harkness and Katz (1964). The exact test is considered by Gail and
Gart (1973), Garside and Mack (1976), and McDonald, Davis, and Milliken (1977).
For methods of combining the test statistics in several 2 x 2 contingency tables
see Radhakrishna (1965), Nelson (1966), Meeker (1978), and Zelen (1971). Possible
errors in the marginal totals because of misclassification is the subject of many
papers, including ones by Chiacchierini and Arnold (1977) and Plackett (1977).
Other related papers are by Fienberg and Gilbert (1970), Upton and Lee (1976),
and Ray (1976). An excellent book by Fleiss (1973) is concerned primarily with
discussion of 2 X 2 contingency tables.
KERCISES
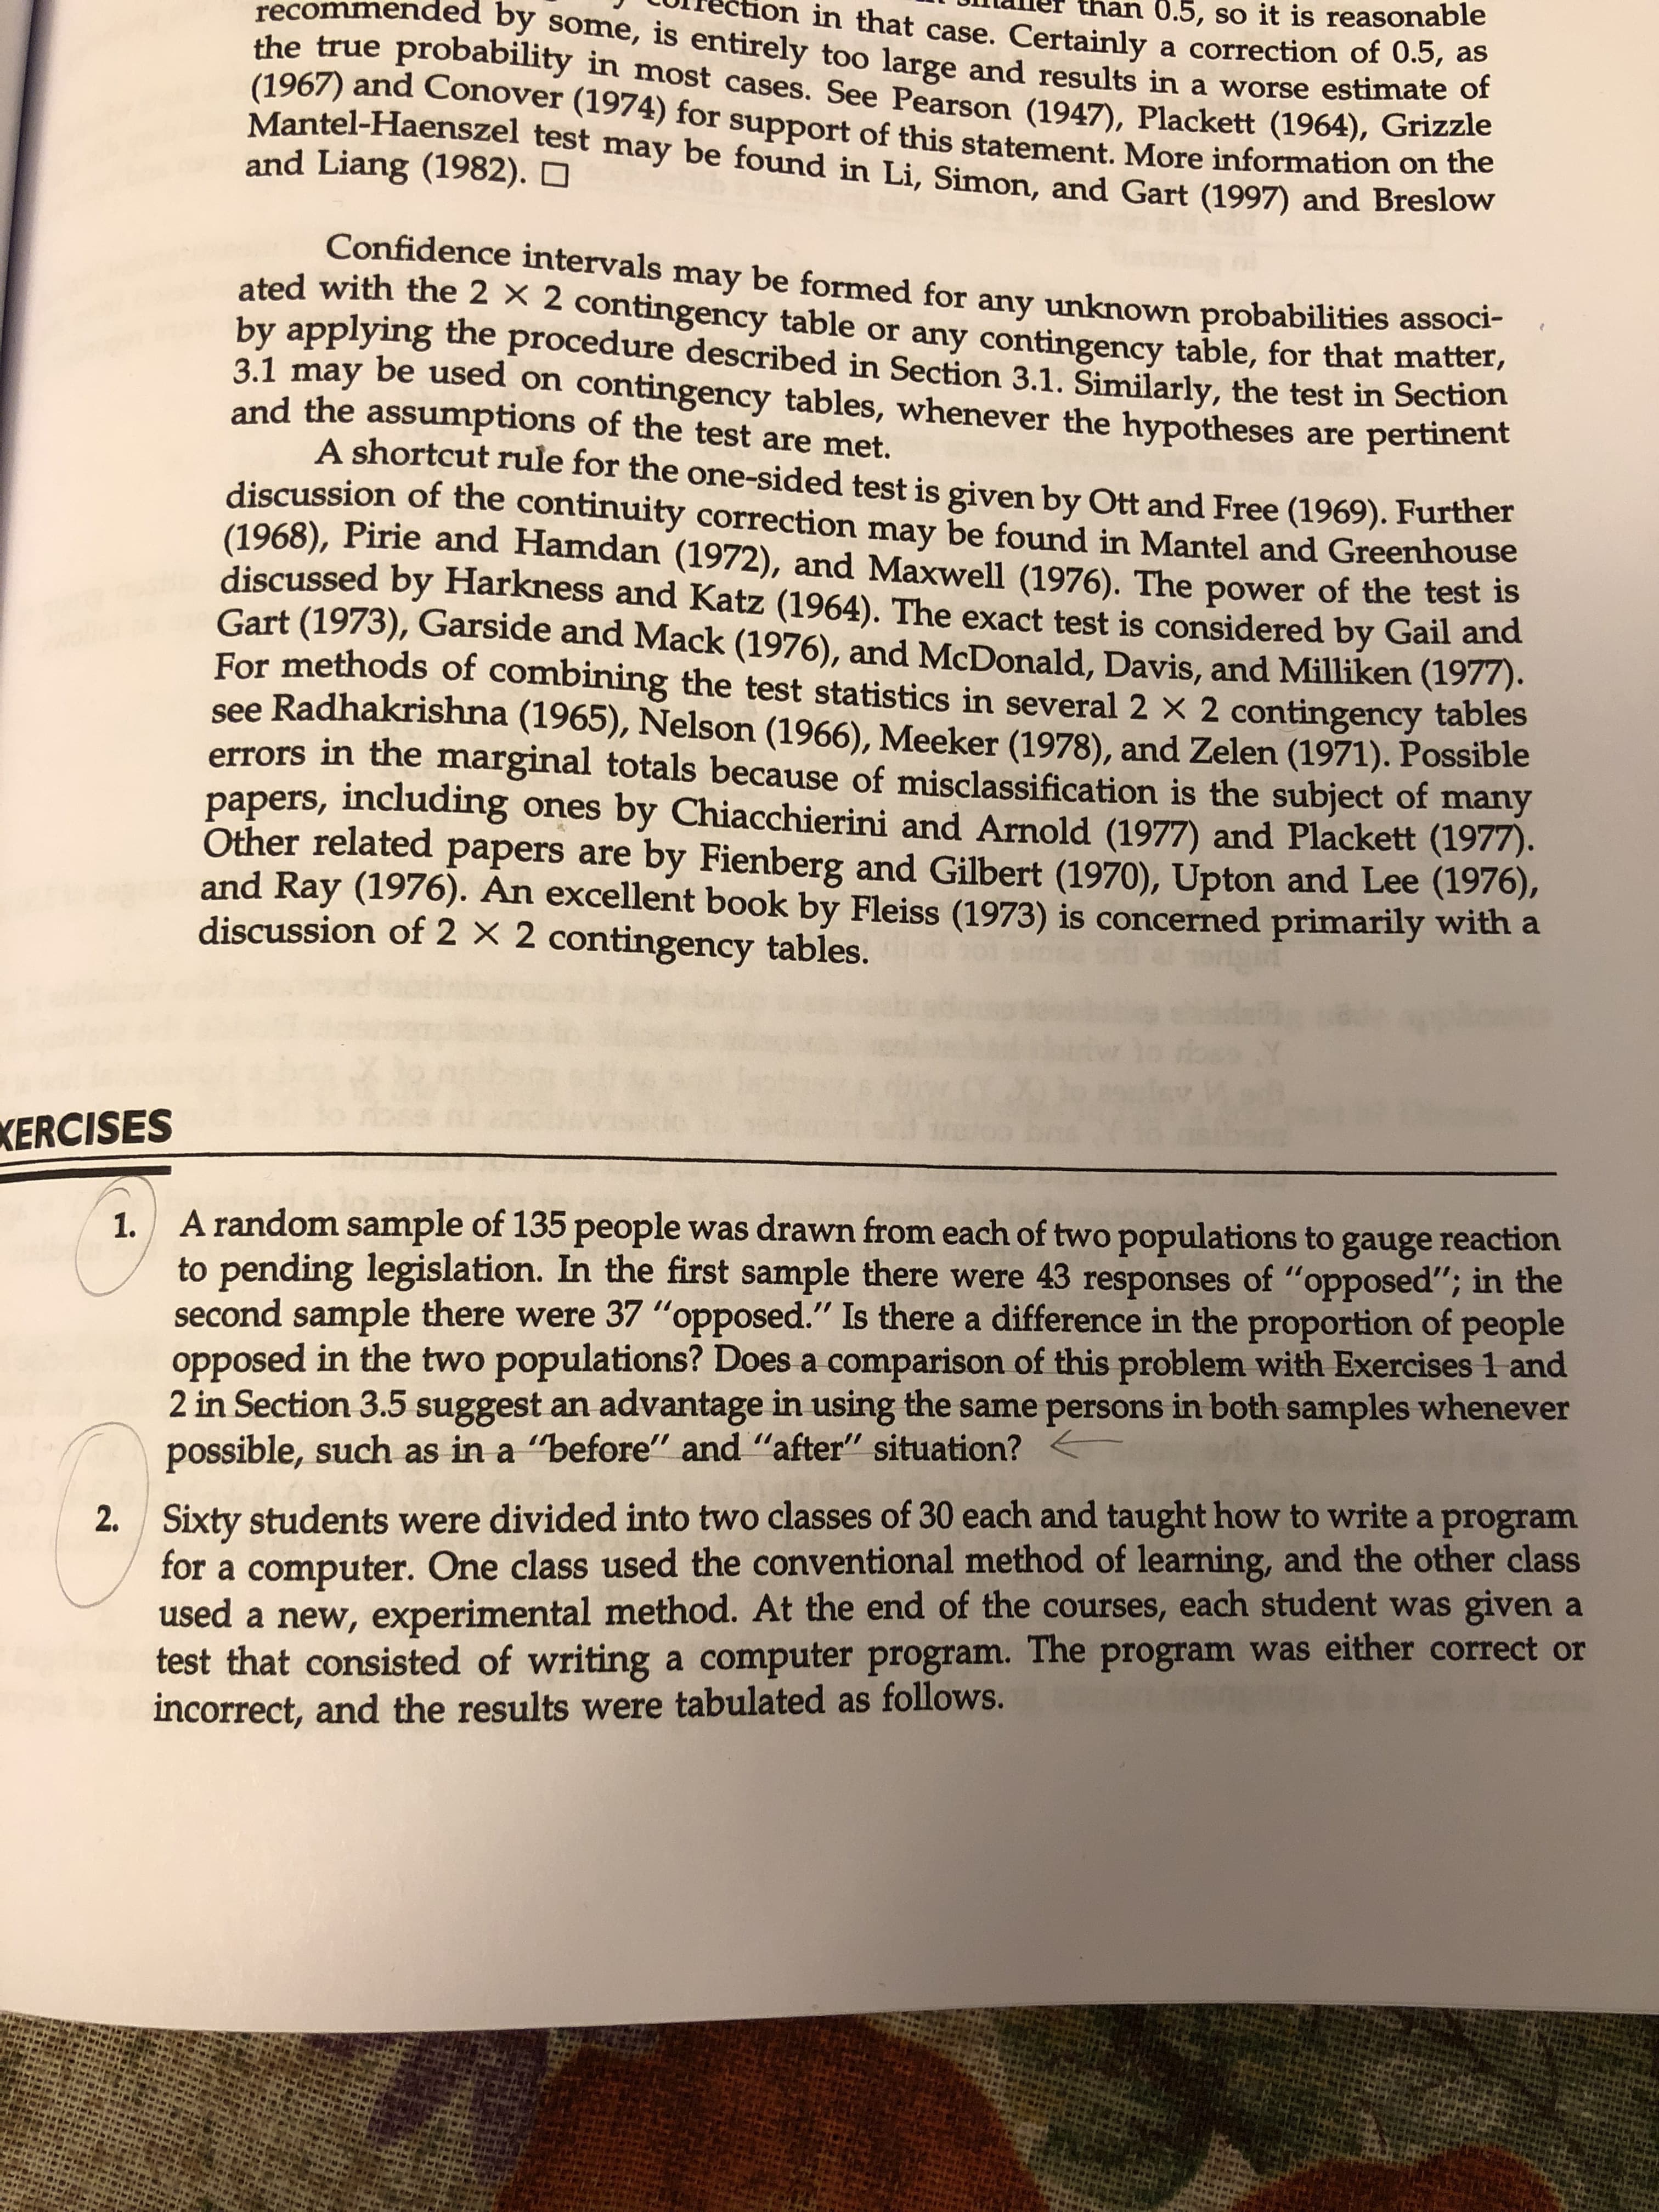
A random sample of 135 people was drawn from each of two populations to gauge reaction
to pending legislation. In the first sample there were 43 responses of "opposed'"; in the
second sample there were 37 "opposed." Is there a difference in the proportion of people
opposed in the two populations? Does a comparison of this problem with Exercises 1 and
in Section 3.5 suggest an advantage in using the same persons in both samples whenever
possible, such as in a "before" and "after" situation?
1.
Sixty students were divided into two classes of 30 each and taught how to write a program
for a computer. One class used the conventional method of learning, and the other class
used a new, experimental method. At the end of the courses, each student was given a
test that consisted of writing a computer program. The program was either correct or
incorrect, and the results were tabulated as follows.
2.
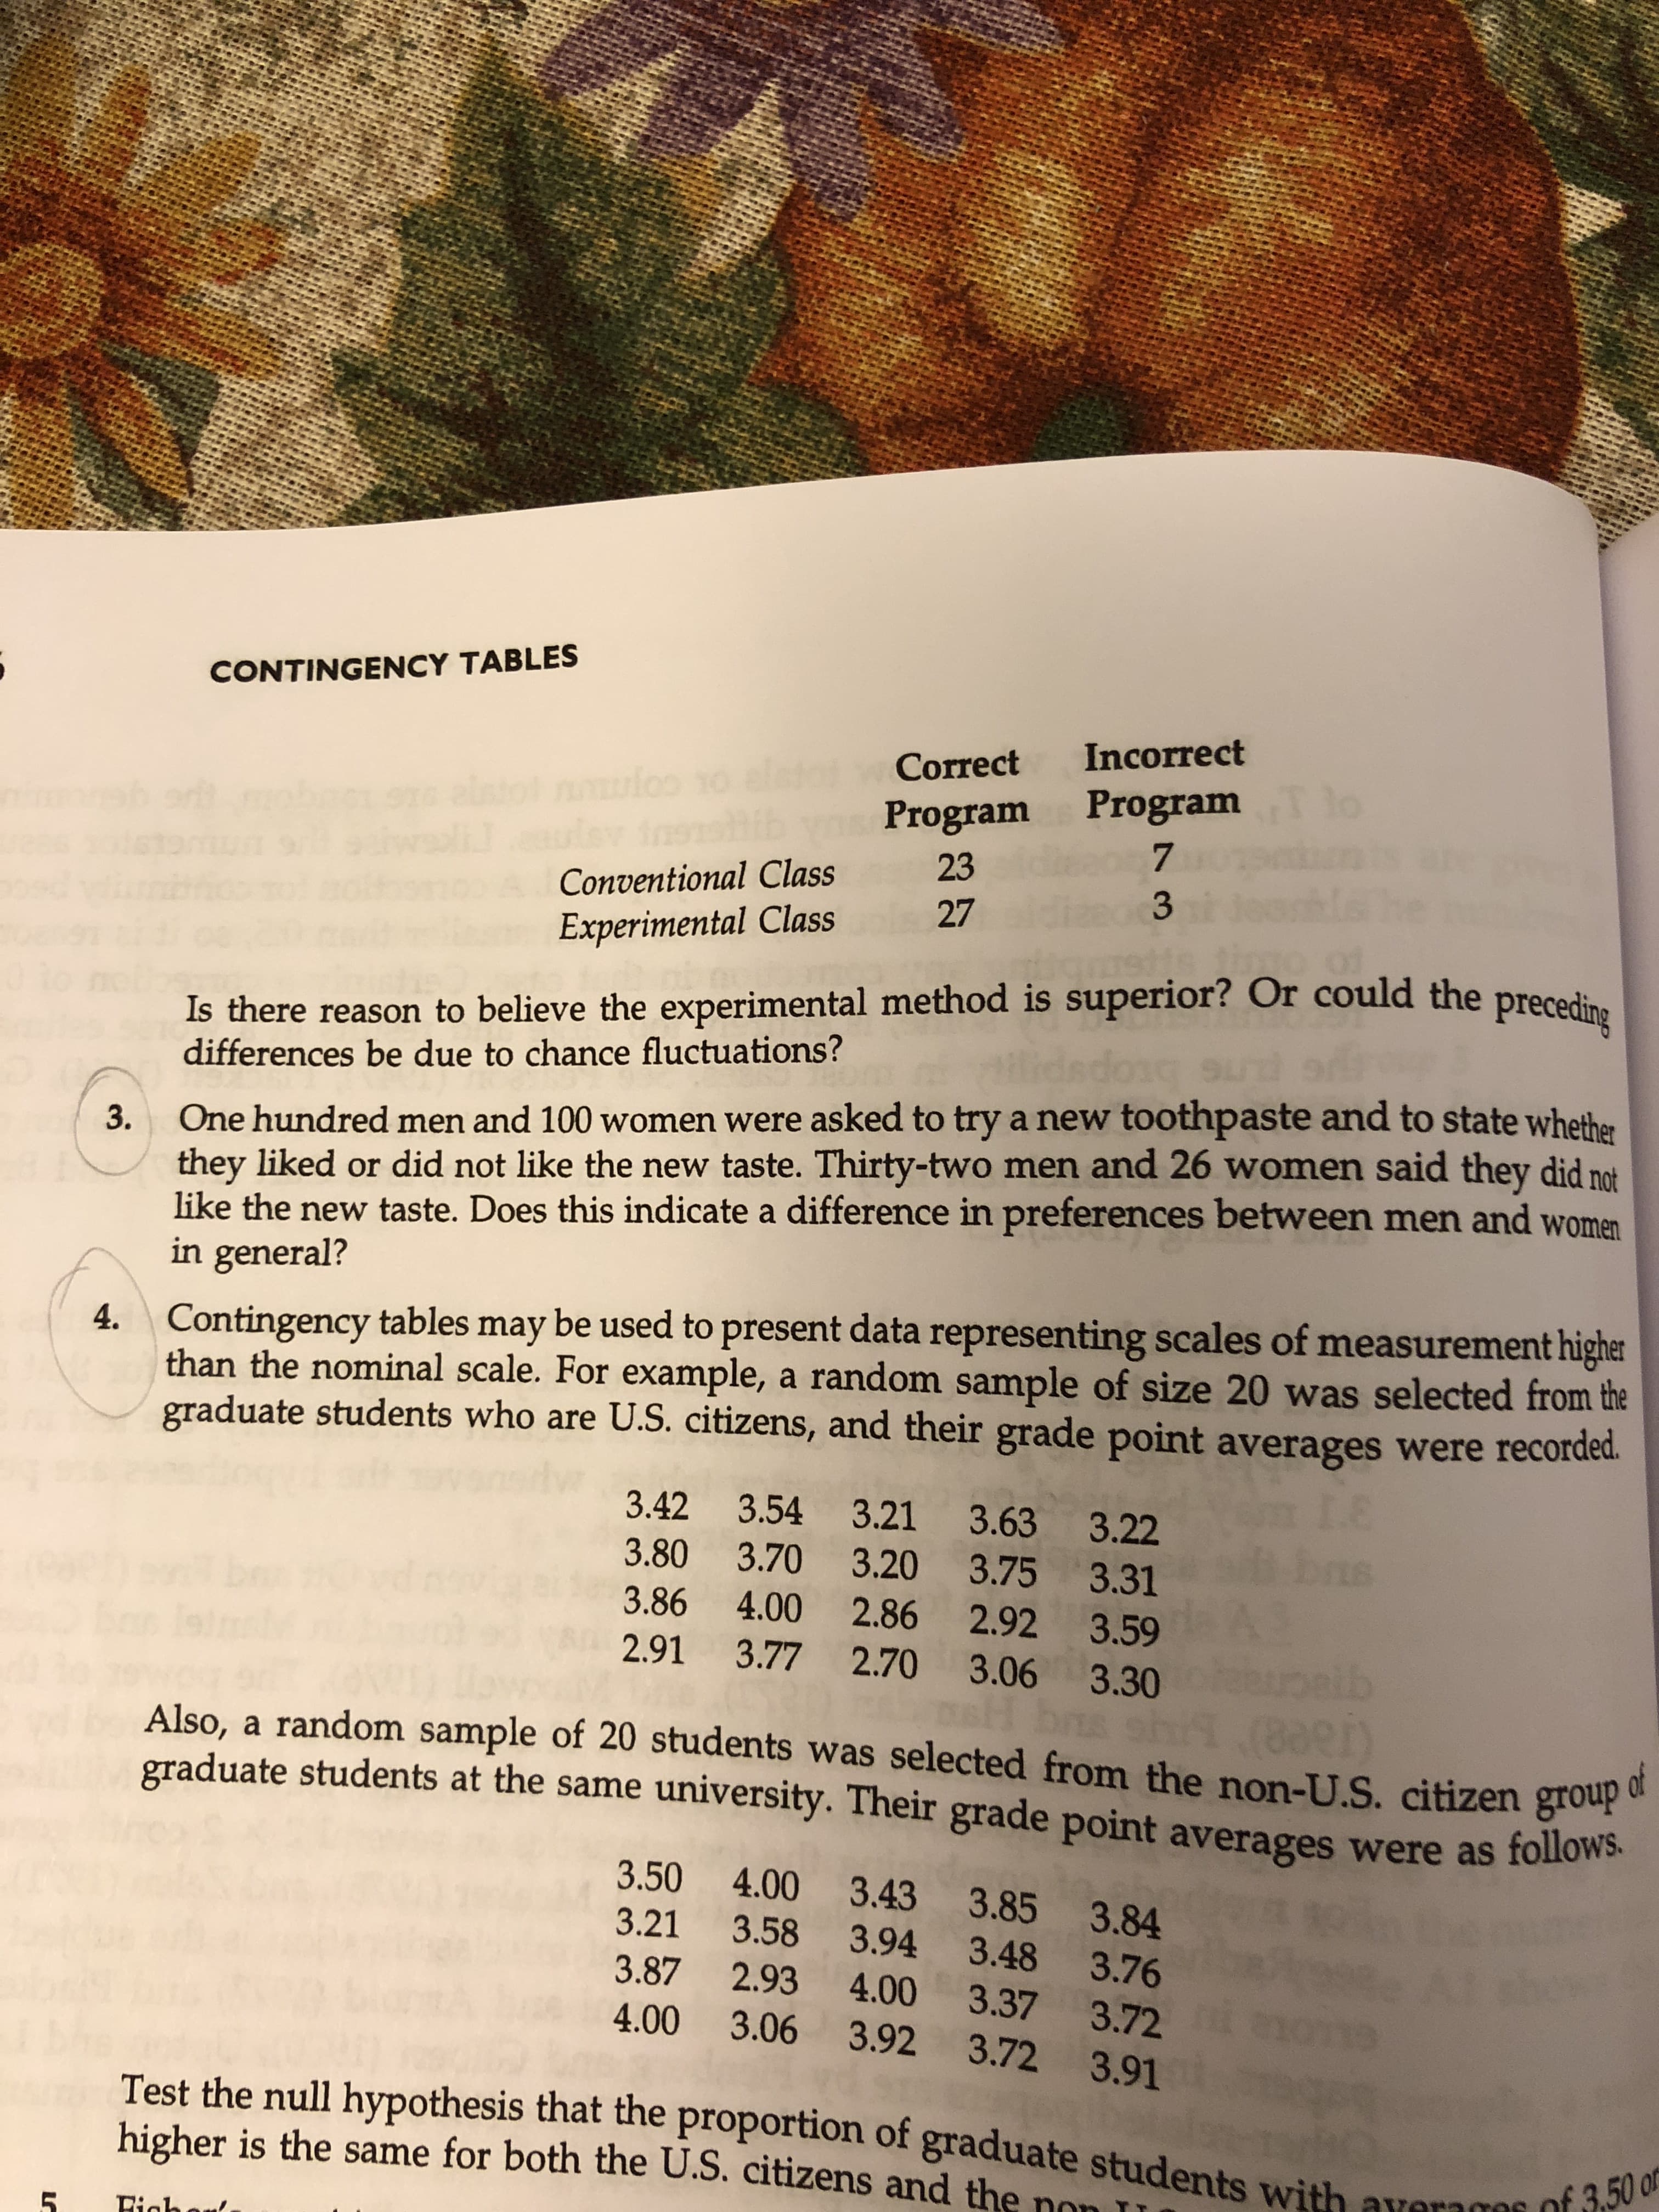
Transcribed Image Text:CONTINGENCY TABLES
Incorrect
Correct
fo 10
isv insltib
elsto
Program o
Program
7
23
Conventional Class
27
Experimental Class
Ms timo of
Is there reason to believe the experimental method is superior? Or could the preceding
differences be due to chance fluctuations?
One hundred men and 100 women were asked to try a new toothpaste and to state whether
they liked or did not like the new taste. Thirty-two men and 26 women said they did not
like the new taste. Does this indicate a difference in preferences between men and women
in general?
3.
4. Contingency tables may be used to present data representing scales of measurement higher
than the nominal scale. For example, a random sample of size 20 was selected from the
graduate students who are U.S. citizens, and their grade poirnt averages were recorded.
3.42 3.54 3.21 3.63 3.22
3.80 3.70 3.20 3.75 3.31
3.86 4.00 2.86 2.92 3.59
2.91 3.77 2.70 3.06 3.30
LE
Also, a random sample of 20 students was selected from the non-U.S. citizen group
graduate students at the same university. Their grade point averages were as follows.
of
3.50 4.00 3.43 3.85 3.84
3.21 3.58 3.94 3.48 3.76
3.87 2.93 4.00 3.37 3.72
4.00 3.06 3.92 3.72 3.91
Test the null hypothesis that the proportion of graduate students with averagos of 3.50 o
higher is the same for both the U.S. citizens and the
Fiaha
5
n
Expert Solution
This question has been solved!
Explore an expertly crafted, step-by-step solution for a thorough understanding of key concepts.

This is a popular solution!

Trending now
This is a popular solution!

Step by step
Solved in 3 steps with 1 images

Knowledge Booster


Learn more about
Need a deep-dive on the concept behind this application? Look no further. Learn more about this topic, statistics and related others by exploring similar questions and additional content below.Recommended textbooks for you
College Algebra
Algebra
ISBN:
9781305115545
Author:
James Stewart, Lothar Redlin, Saleem Watson
Publisher:
Cengage Learning

Algebra and Trigonometry (MindTap Course List)
Algebra
ISBN:
9781305071742
Author:
James Stewart, Lothar Redlin, Saleem Watson
Publisher:
Cengage Learning
College Algebra
Algebra
ISBN:
9781305115545
Author:
James Stewart, Lothar Redlin, Saleem Watson
Publisher:
Cengage Learning
Algebra and Trigonometry (MindTap Course List)
Algebra
ISBN:
9781305071742
Author:
James Stewart, Lothar Redlin, Saleem Watson
Publisher:
Cengage Learning