5) Use the model'equation to predict the value of y using any x value of your choice within the given data range, use a value 0 .05. State the confidence limits and prediction limits. 6) Test the hypothesis Ho versus using a= 0.05. Find the P-value for this test and draw conclusion about the usefulness of the regression equation in Q2.
5) Use the model'equation to predict the value of y using any x value of your choice within the given data range, use a value 0 .05. State the confidence limits and prediction limits. 6) Test the hypothesis Ho versus using a= 0.05. Find the P-value for this test and draw conclusion about the usefulness of the regression equation in Q2.

MATLAB: An Introduction with Applications
6th Edition
ISBN:9781119256830
Author:Amos Gilat
Publisher:Amos Gilat
Chapter1: Starting With Matlab
Section: Chapter Questions
Problem 1P

Related questions
Question
Can you help me with 5 and 6
please no handwriting
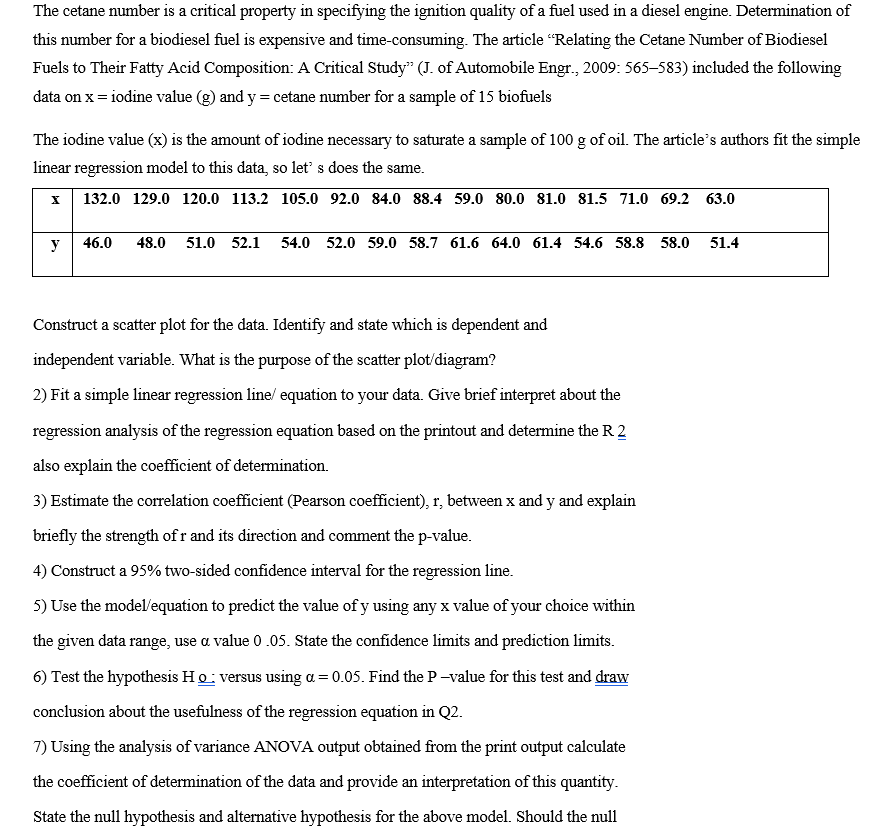
Transcribed Image Text:The cetane number is a critical property in specifying the ignition quality of a fuel used in a diesel engine. Determination of
this number for a biodiesel fuel is expensive and time-consuming. The article "Relating the Cetane Number of Biodiesel
Fuels to Their Fatty Acid Composition: A Critical Study" (J. of Automobile Engr., 2009: 565–583) included the following
data on x = iodine value (g) and y = cetane number for a sample of 15 biofuels
The iodine value (x) is the amount of iodine necessary to saturate a sample of 100 g of oil. The article's authors fit the simple
linear regression model to this data, so let s does the same.
132.0 129.0 120.0 113.2 105.0 92.0 84.0 88.4 59.0 80.0 81.0 81.5 71.0 69.2 63.0
y
46.0
48.0
51.0 52.1
54.0 52.0 59.0 58.7 61.6 64.0 61.4 54.6 58.8 58.0
51.4
Construct a scatter plot for the data. Identify and state which is dependent and
independent variable. What is the purpose of the scatter plot/diagram?
2) Fit a simple linear regression line/ equation to your data. Give brief interpret about the
regression analysis of the regression equation based on the printout and determine the R 2
also explain the coefficient of determination.
3) Estimate the correlation coefficient (Pearson coefficient), r, between x and y and explain
briefly the strength of r and its direction and comment the p-value.
4) Construct a 95% two-sided confidence interval for the regression line.
5) Use the model'equation to predict the value of y using any x value of your choice within
the given data range, use a value 0 .05. State the confidence limits and prediction limits.
6) Test the hypothesis Ho: versus using a = 0.05. Find the P-value for this test and draw
conclusion about the usefulness of the regression equation in Q2.
7) Using the analysis of variance ANOVA output obtained from the print output calculate
the coefficient of determination of the data and provide an interpretation of this quantity.
State the null hypothesis and alternative hypothesis for the above model. Should the null
Expert Solution
This question has been solved!
Explore an expertly crafted, step-by-step solution for a thorough understanding of key concepts.

This is a popular solution!

Trending now
This is a popular solution!

Step by step
Solved in 3 steps with 18 images

Knowledge Booster


Learn more about
Need a deep-dive on the concept behind this application? Look no further. Learn more about this topic, statistics and related others by exploring similar questions and additional content below.Recommended textbooks for you
MATLAB: An Introduction with Applications
Statistics
ISBN:
9781119256830
Author:
Amos Gilat
Publisher:
John Wiley & Sons Inc

Probability and Statistics for Engineering and th…
Statistics
ISBN:
9781305251809
Author:
Jay L. Devore
Publisher:
Cengage Learning

Statistics for The Behavioral Sciences (MindTap C…
Statistics
ISBN:
9781305504912
Author:
Frederick J Gravetter, Larry B. Wallnau
Publisher:
Cengage Learning
MATLAB: An Introduction with Applications
Statistics
ISBN:
9781119256830
Author:
Amos Gilat
Publisher:
John Wiley & Sons Inc
Probability and Statistics for Engineering and th…
Statistics
ISBN:
9781305251809
Author:
Jay L. Devore
Publisher:
Cengage Learning
Statistics for The Behavioral Sciences (MindTap C…
Statistics
ISBN:
9781305504912
Author:
Frederick J Gravetter, Larry B. Wallnau
Publisher:
Cengage Learning

Elementary Statistics: Picturing the World (7th E…
Statistics
ISBN:
9780134683416
Author:
Ron Larson, Betsy Farber
Publisher:
PEARSON

The Basic Practice of Statistics
Statistics
ISBN:
9781319042578
Author:
David S. Moore, William I. Notz, Michael A. Fligner
Publisher:
W. H. Freeman

Introduction to the Practice of Statistics
Statistics
ISBN:
9781319013387
Author:
David S. Moore, George P. McCabe, Bruce A. Craig
Publisher:
W. H. Freeman