il T-Mobile 11:42 am 48% Home Edit Yesterday 5:52 pm Canvas 因 国 Part of an Excel regression output relating salary for programmer (dependent variable) with three independent variables: Test score, Graduate Degree, and Experience is shown below. Coeffic. Std. Err. t Stat P-value Intercept 7.9448 7.3808 1.0764 0.2977 Test Score 1.1476 0.2976 4.8561 0.0850 Grad. 0.1969 0.0899 2.1905 0.0011 Degree Experience -2.2804 1.9866 -1.0479 0.3679 Refer to Exhibit 6. Based on the data in Exhibit 4, what would be the multiple regression equation: (let Test Score-X. Grad. Degree- X2, and Experience. = X3) O9-11476X +0.1969 X2-2.2804X3 09-7.9448 11476X1+0.1969 X2-2.2804X3 O9-79448+1.1476X +0.1969 X2 9-7.9448 +0.2976X1 + 00899 X2 +1.9866X3
il T-Mobile 11:42 am 48% Home Edit Yesterday 5:52 pm Canvas 因 国 Part of an Excel regression output relating salary for programmer (dependent variable) with three independent variables: Test score, Graduate Degree, and Experience is shown below. Coeffic. Std. Err. t Stat P-value Intercept 7.9448 7.3808 1.0764 0.2977 Test Score 1.1476 0.2976 4.8561 0.0850 Grad. 0.1969 0.0899 2.1905 0.0011 Degree Experience -2.2804 1.9866 -1.0479 0.3679 Refer to Exhibit 6. Based on the data in Exhibit 4, what would be the multiple regression equation: (let Test Score-X. Grad. Degree- X2, and Experience. = X3) O9-11476X +0.1969 X2-2.2804X3 09-7.9448 11476X1+0.1969 X2-2.2804X3 O9-79448+1.1476X +0.1969 X2 9-7.9448 +0.2976X1 + 00899 X2 +1.9866X3

Glencoe Algebra 1, Student Edition, 9780079039897, 0079039898, 2018
18th Edition
ISBN:9780079039897
Author:Carter
Publisher:Carter
Chapter10: Statistics
Section10.3: Measures Of Spread
Problem 1GP

Related questions
Question
Transcribed Image Text:il T-Mobile
11:42 am
48%
Home
Edit
Yesterday 5:52 pm
Canvas
因 国
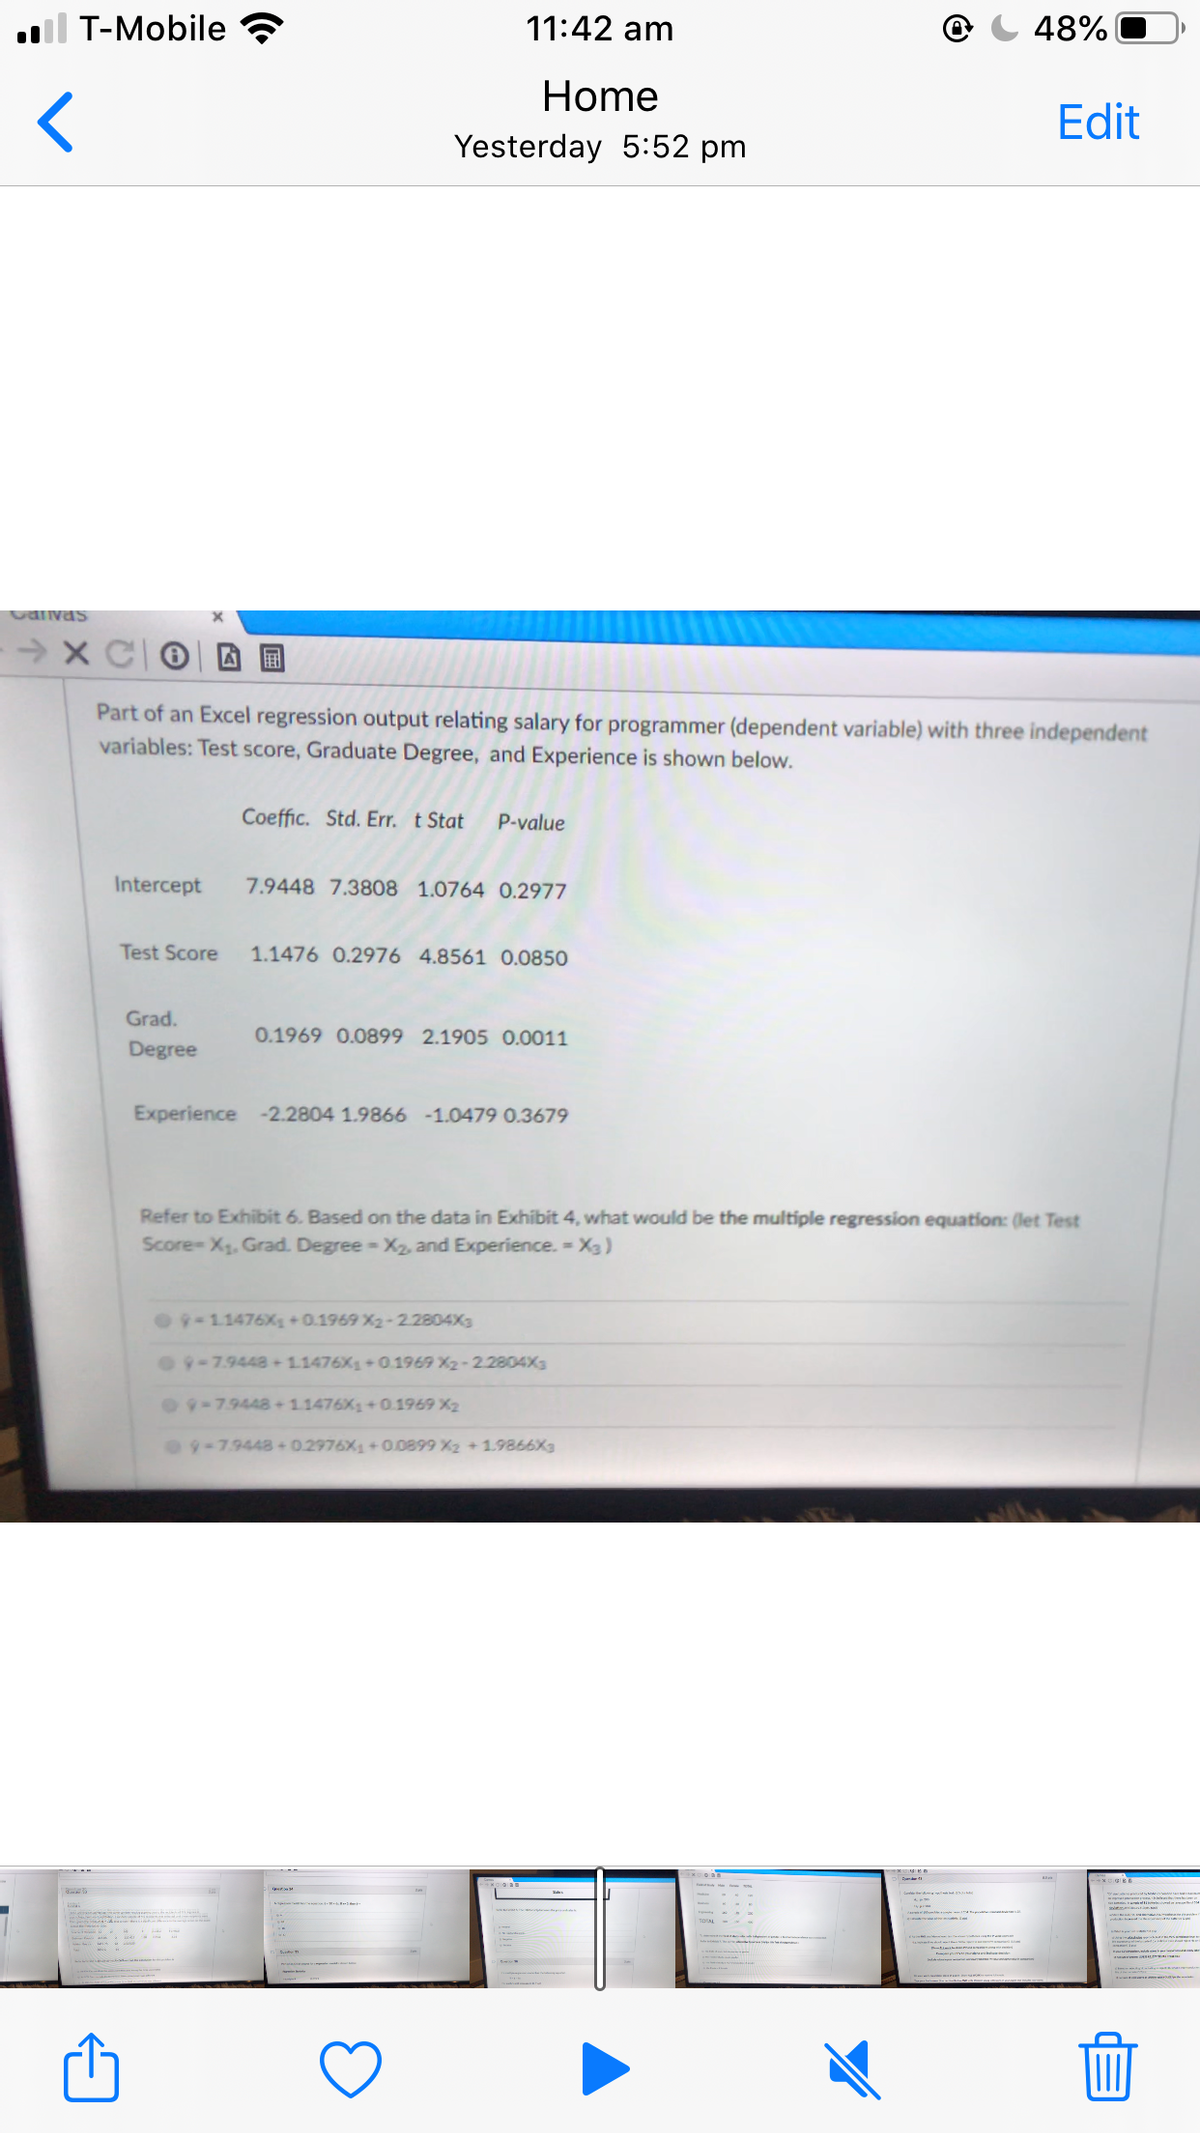
Part of an Excel regression output relating salary for programmer (dependent variable) with three independent
variables: Test score, Graduate Degree, and Experience is shown below.
Coeffic. Std. Err. t Stat
P-value
Intercept
7.9448 7.3808 1.0764 0.2977
Test Score
1.1476 0.2976 4.8561 0.0850
Grad.
0.1969 0.0899 2.1905 0.0011
Degree
Experience -2.2804 1.9866 -1.0479 0.3679
Refer to Exhibit 6. Based on the data in Exhibit 4, what would be the multiple regression equation: (let Test
Score-X. Grad. Degree- X2, and Experience. = X3)
O9-11476X +0.1969 X2-2.2804X3
09-7.9448 11476X1+0.1969 X2-2.2804X3
O9-79448+1.1476X +0.1969 X2
9-7.9448 +0.2976X1 + 00899 X2 +1.9866X3
Expert Solution
This question has been solved!
Explore an expertly crafted, step-by-step solution for a thorough understanding of key concepts.

Step by step
Solved in 2 steps with 1 images

Recommended textbooks for you
Glencoe Algebra 1, Student Edition, 9780079039897…
Algebra
ISBN:
9780079039897
Author:
Carter
Publisher:
McGraw Hill

Big Ideas Math A Bridge To Success Algebra 1: Stu…
Algebra
ISBN:
9781680331141
Author:
HOUGHTON MIFFLIN HARCOURT
Publisher:
Houghton Mifflin Harcourt
Glencoe Algebra 1, Student Edition, 9780079039897…
Algebra
ISBN:
9780079039897
Author:
Carter
Publisher:
McGraw Hill
Big Ideas Math A Bridge To Success Algebra 1: Stu…
Algebra
ISBN:
9781680331141
Author:
HOUGHTON MIFFLIN HARCOURT
Publisher:
Houghton Mifflin Harcourt