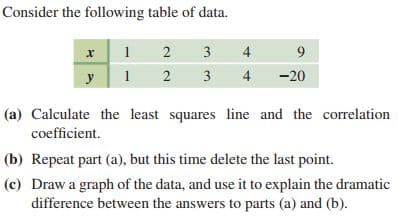
Consider the following table of data. 1 2 4 9. y 1 2 4 -20 (a) Calculate the least squares line and the correlation coefficient. (b) Repeat part (a), but this time delete the last point. (c) Draw a graph of the data, and use it to explain the dramatic difference between the answers to parts (a) and (b). 3. 3.


Q: John's parents recorded his height at various ages up to 66 months. They decide to use the least-…
A: Given: John's parents recorded his height at various ages up to 66 months. They decide to use the…
Q: The following data represent the speed at which a ball was hit (in miles per hour) and the distance…
A: Dear students as per guidelines we answer the first three subparts only. Solution
Q: An article included a summary of findings regarding the use of SAT I scores, SAT II scores, and high…
A: Note: Hi there! Thank you for posting the question. As there are several independent questions,…
Q: il T-Mobile 11:42 am 48% Home Edit Yesterday 5:52 pm Canvas 因 国 Part of an Excel regression output…
A:
Q: The table below shows the lIQ of ten students and the number of hours of TV each watches per week.…
A: The data set is: IQ TV 110 8 105 10 110 9 140 1 100 11 125…
Q: The following table gives the gold medal times for every other Summer Olympics for the women’s…
A: Since we only answer up to 3 sub-parts, I'll answer the 1st 3 sub-parts. Please resubmit the…
Q: The following gives the number of accidents that occurred on Florida State Highway 101 during the…
A:
Q: 6. Consider the following set of data points: 2 4 14 20 23 25 Y 2 6 14 20 12 19 Construct a scatter…
A: Scatter plot is the graphical representation of the relationship between two variables of a…
Q: c) If a country increases its life expectancy, the happiness index will decrease increase (d) If…
A: The correlation and regression are used for the Bivariate data, which means there should be two…
Q: For the table of data find the following. a. Draw a scatterplot b. Calculate the correlation…
A: Scatter plot: Therefore, the correct answer is "Option c".
Q: 2. A researcher aims to investigate the determinants of accounting quality of firms. With a sample…
A: a) For the independent variable ASSET, slope coefficient = -0.0033 This means that for 1 unit…
Q: Calculate the Pearson correlation coefficient between the two variables, to two decimal places.…
A: Since you have posted a question with multiple sub-parts, we will solve first three subparts for…
Q: The average number of people in a family that received welfare for various years is given below.…
A: Year(x) Welfare(y) xy x2 y2 1969 4 7876 3876961 16 1973 3.6 7102.8 3892729 12.96 1975…
Q: Identify which of the following scatterplots contain possible outliers or observations influential…
A:
Q: 1. David was comparing the number of vocabulary words children know about transportation at various…
A: Given information Predictor Coef SE Coef T P Constant 3.371 1.337 2.52 0.065…
Q: Like father, like son: In 1906, the statistician Karl Pearson measured the heights of 1078 pairs of…
A: Given: y^=50.5230+0.2781x∑x-x¯2=41.2733α=0.05 x y 69.3 71.4 66.7 68.8 70.7 71 65.7 70.9…
Q: The following gives the number of accidents that occurred on Florida State Highway 101 during the…
A: Sum of X = 10Sum of Y = 229Mean X = 2.5Mean Y = 57.25Sum of squares (SSX) = 5Sum of products (SP) =…
Q: Given a collection of pairs (x, y), find both the correlation coefficient, r, and the regression or…
A: Solution-: We find (a) Correlation (b) Regression line
Q: Suppose a doctor measures the height, x, and head circumference, y, of 11 children and obtains the…
A: Given: Correlation coefficient (r) = 0.899
Q: What is the answer?
A:
Q: The marks obtained by 10 students in statistics (x) and algebra (y) are as follows: Table 6 88 82 73…
A: Correlation Coefficient: Let (x1, y1), (x2, y2), ... , (xn, yn) be n set of observations for the…
Q: Q2. A random sample of seven drivers insured with a company and having similar auto insurance…
A: "Since you have posted a question with multiple subparts, we will solve first 3 sub-parts for you.…
Q: 1. A publisher of books has produced five comparable Statistical Management books with the following…
A: Consider the following calculations:
Q: 1. An experiment was run and the following data table was produced: Input Response 2.5 3 4 4.5 (a)…
A: Using Excel formula “=CORREL(A2:A6,B2:B6)”, the correlation coefficient for the data is obtained as…
Q: 14.4 THE STARTING SALARY CASE StartSal The chairman of the marketing department at a large state…
A: Given, The chairman of the marketing department at a large state university undertakes a stdy to…
Q: Suppose that given a particular dataset of (x, y) pairs, the correlation coef- ficient (r) of the…
A: The correlation coefficient defined the relationship between two quantitative variables. The value…
Q: The following data represent the speed at which a ball was hit (in miles per hour) and the distance…
A: Since you have posted a question with multiple sub-parts, we will solve first three sub- parts for…
Q: Y 5 4 5 10 12 15 Assume that x is the explanatory variable and y is the response variable. What is…
A: The strength of the relationship between 2 variables can be calculated using the correlation…
Q: Suppose a doctor measures the height, x, and head circumference, y, of 11 children and obtains the…
A: The correlation coefficient (r)=0.904 we know that, coefficient of determination measure…
Q: Researchers measured the percent body fat and the preferred amount of salt (percent weight/volume)…
A: Data given x y 0.2 20 0.3 30 0.4 22 0.5 30 0.6 38 0.8 23 1.1 30
Q: ] 11. The data in the table can be entered into a calculator to determine a linear equation of best…
A: Let x represents the elapsed time in minutes y represents the depth of water in inches.
Q: 2. Given the following data: X number of inventors in company Y number of patents 12.0 15.0 17.0…
A: Hi, we are supposed to answer three subparts at a time. Since you have not mentioned which subpart…
Q: 3. Fit a linear trend to the following data by the least squares method. Verijy mar Ey-y)=0, where…
A: If the values of a variable when plotted against times cluster more or less around a straight line…
Q: Practice question 10
A: The concepts of least square regression line and regression equation are used to solve the problem.…
Q: Consider the following table of data. x 0 1 2 y 4 1 0 1 3 4 1 4 (a) Calculate the least squares line…
A: x y xy x^2 X = x-x̄ Y= y - ȳ XY 0 4 0 0 -2 2 -4 1 1 1 1 -1 -1 1 2 0 0 4 0 -2 0 3 1 3 9 1 -1…
Q: 1. A publisher of books has produced five comparable Statistical Management books with the following…
A:
Q: In a study of association between age (x) and the abil-ity to recall a list of animal names (y), the…
A: We know,the residual for a particular value of x is ex =yx-ypredx,where yx is the value of y at x…
Q: One of nature's patterns connects the percent of adult birds in a colony that return from the…
A: Since you have asked multiple sub parts of the question, we will solve first three sub parts for…
Q: 1) A sample of fast food menu items is taken and the item's sodium and calories are reported. Sodium…
A: a) Sodium(mg) Calories 350 160 970 300 590 290 250 160 635 180 520 240 800 320…
Q: If all the points in a scatter diagram lie on the least squares regression line, then the…
A: Given that, All the points in a scatter diagram lie on the least squares regression line.
Q: Below are the average heights for American boys in 1990. Age (years) Height (cm) birth 50.8 2 83.8…
A: Given data, Age Height 0 50.8 2 83.8 3 91.4 5 106.6 7 119.3…
Q: Intrigued by a 2013 sdy at the University of Nebraska that suggested marijuana smokers may be…
A: Here r2 = 0.134
Q: How strongly do physical characteristics of sisters and brothers correlate? Here are data on the…
A: In this case the brother’s height (x) is the independent variable and the sister’s height (y) is the…
Q: Like father, like son: In 1906, the statistician Karl Pearson measured the heights of 1078 pairs of…
A:
Q: Is each of these True or False? (i) The least squares regression line is the line that minimizes…
A: Note: Hey there! Thank you for the question. As you have posted a question with more than 3…
Q: 2. Given the bivariate data: 1 3 6. y 3 1 a. Draw a scatter diagram for the data. Solution: b. Find…
A:


Trending now
This is a popular solution!

Step by step
Solved in 2 steps with 1 images

- An article included a summary of findings regarding the use of SAT I scores, SAT II scores, and high school grade point average (GPA) to predict first-year college GPA. The article states that "among these, SAT II scores are the best predictor, explaining 17 percent of the variance in first-year college grades. GPA was second at 15.2 percent, and SAT I was last at 13.1 percent." If the data from this study were used to fit a least squares line with y = first-year college GPA and x = high school GPA, what would the value of r2 have been? R2 ____________________%The amount (in millions of dollars) of used autos sold online in a certain country from 2011 to 2015 is given in the following table (x = 0 corresponds to 2011). Year, x 0 1 2 3 4 Sales, y 12.9 13.9 14.65 15.25 15.85 (a) Find an equation of the least-squares line for these data.y = (b) Use the result of part (a) to estimate the sales of used autos online in 2016, assuming that the predicted trend continued. (Round your answer to one decimal place.)$ millionA simple random sample of 100 men aged 25–34 averaged 70 inches in height, and had astandard deviation of 3 inches. Their incomes averaged $34,900 and had a standarddeviation of $17,200. Fill in the blank: From the least-squares line, we would predict thatthe income of a man 70 inches tall would be _____.a) less than $34,900.b) greater than $34,900.c) equal to $34,900.d) We cannot tell unless we know the correlation.
- Suppose a doctor measures the height, x, and head circumference, y, of 11 children and obtains the data below. The correlation coefficient is 0.899 and the least squares regression line is y=0.185x+12.276. Complete parts (a) and (b) below. Height, x 27.75 25.75 26.75 25.75 28 26.5 25.75 26.75 27 27.25 27.25 Head Circumference, y 17.4 17.1 17.2 16.9 17.4 17.1 17.1 17.3 17.3 17.3 17.4 (a) Compute the coefficient of determination, R2. R2=nothing% (Round to one decimal place as needed.) (b) Interpret the coefficient of determination. Approximately nothing% of the variation in ▼ height head circumference is explained by the least-squares regression model. (Round to one decimal place as needed.)The following table shows the percent of water and the number of calories in various canned soups to which 100 g of water are added. (show all the necessary solution) Percent Water in Soups % Water Calories 83.3 28 92.3 26 91.9 39 89.4 57 89.5 57 90.5 36 91.9 32 91.7 32 a. Find the equation of the least squares line for the data. b. Use the equation in part a to find the expected number of calories in a soup that is 87% water. c. Determine the correlation coefficient of the data.When we use a least-squares line to predict y values for x values beyond the range of x values found in the data, are we extrapolating or interpolating? Are there any concerns about such predictions?