1. Calculate the Variance for each lake 2. Plug values into the t-test equation and find 'calculated t' 3. Determine the df and look up 'critical t' with a p-value of 0.05


Q: Consider the following econometric model y = Bo + B₁ Before + B₂ Treatment + B3AfterXTreatment + u…
A: We have given a econometric model and also given that variable names are self explanatory. Then we…
Q: ) Compute the mean and variance of Yt b) Compute the first two autocovariances of Yt c) Compute…
A:
Q: Find the critical value, z0, from the z table for the given parameters. a=0.10 left tailed test
A:
Q: In the least-squares regression model, y, = B, X; + Bo +&, &, is a random error term with mean and…
A: “Since you have asked multiple questions, we will solve the first question for you. If you want any…
Q: The thermal conductivity (R-Value) of 24 samples of newly developed inulating material follows:…
A: Given the data on thermal conductivity of 24 samples of newly developed inulating material. Sample…
Q: A snack food manufacturer estimates that the variance of the number of grams of carbohydrates in…
A: (a) Let σ2 be the population variance of the number of grams of carbohydrates in servings of its…
Q: 1. The experimental data on the hardness of the Hebel brick with 2 drying methods (methods A and B)…
A: Given the experimental data on the hardness of the Hebel brick with two drying methods(methods A and…
Q: a.2. Solve for the Bartlett’s critical value using α = 0.01. a.3. Conclude if the variances are…
A: 67 72 75 79 93 94 96 89 95 95 97 90 91 95 98 88 97 96 98 91 96 98 97 90 97…
Q: Consider the following regression equation: Y = Bo +P,X;+H. where X,, Y. Po B, and u, denote the…
A: Given : Regression equation : yi = β0 + β1 xi + μi
Q: The thermal conductivity (R-Value) of 24 samples of newly developed inulating material follows:…
A:
Q: Consider a simple linear regression model Yi = Bo + B1x; + Ei, i = 1, 2,3 with x; = i/3 for i = 1,2,…
A: Given a simple linear regression model yi=β0+β1xi+εi , i=1, 2, 3 with xi=i3
Q: When the classical linear model assumptions are fulfilled, the OLS estimator B is... t-distributed…
A: Introduction: It is required to identify the correct option.
Q: Q2) Given the data points (0,7), (2,11), (3,28) use Lagrange's method to determine У(1).
A:
Q: A class-B transistor amplifier with a volage gain of two has cross-over distortion, resulting in a…
A:
Q: 4. A material used in the construction industry contains an impurity suspected of having an adverse…
A: x p=(x-250)/50 y Δy Δ2y Δ3y Δ4y Δ5y Δ6y 100 -3 10.63 2.4…
Q: Consider the following scatter diagram: 25 20 15 10 Initial Which of the following best describes…
A: A scatter plot is given between initial and final temperatures.
Q: A snack food manufacturer estimates that the variance of the number of grams of carbohydrates in…
A:
Q: 6) Consider the following scatterplots of a dependent variable Y against an independent variable X.…
A: Hetersoskedasticity happens when the standard deviation of error term is not constant over different…
Q: temperatures (°C) reported were as follows: 23.01, 22.22, 22.04, 22.62, and 22.59. Test that the…
A: Given that Five samples of the material were tested in a structure, and the average interior…
Q: Calculate C.I, Sample Skewness and Sample Kurtosis from the following grouped data: Class 5-15 15-25…
A:
Q: The Turbine Oil Oxidation Test (TOST) and the Rotating Bomb Oxidation Test (RBOT) are two different…
A: From given data, X Y X*Y X*X Y*Y 4200 370 1554000 17640000 136900 3600 340 1224000 12960000…
Q: For an AR(1) model with Y = 7.5, o = -0.6, µ= 5, and o? = 1, %3D %3D (a) Find Y(1), Ý(2), and Ý:(6).…
A:
Q: Question 12 A maintenance fırm has gathered the following information regarding the failure…
A: Given: Gas leaks Yes Gas leaks No Total Electrical failure Yes 55 17 72 Electrical failure…
Q: 3. The signal (peak area) measured for different standard concentrations of silver in atomic…
A: From the given information, Consider, Y = peak area that needs to be measured and X1 =Ag , X2 =…
Q: Find the critical values of Z for a two tail test at alpha a = 0.05 LOS. Click this link for Normal…
A:
Q: The thermal conductivity (R-Value) of 23 samples of newly developed inulating material follows:…
A: Solution: Let X be the thermal conductivity. From the given information, the confidence level is…
Q: 1. Suppose that Y, follows the Moving Average process of order 1 (MA(1)) model Y₁ = &-0₁-1, where is…
A: Suppose Yt follows the moving average process of order 1 MA(1) model. Yt=εt-θεt-1 where εt is…
Q: Find the critical values of Z for a two tail test at alpha a = 0.01 LOS. Click this link for Normal…
A: Given: The level of significance is α=0.01. The test provided is a Z test for two tailed.
Q: 11. Find out the likely production corresponding to a rainfall of 40 cms. from the following däta :…
A: Regression: By regression we mean estimation or prediction of the average value of one variable for…
Q: The thermal conductivity (R-Value) of 24 samples of newly developed inulating material follows:…
A: The sample size (n) is 24.
Q: Consider the linear model y = Bo + B1r + u. Which criterion is used to find the OLS estimators for…
A: Solution: From the given information, the linear model is
Q: Consider the following five data points: X -1 0 1 2 3 Y -1 1 2 4 5 a. Use regression analysis to…
A: Given: Sr. No. x y 1 -1 1 2 0 1 3 1 2 4 2 4 5 3 5
Q: Calculate C.I, Sample Skewness and Sample Kurtosis from the following grouped data: Class 10-20…
A: Given that Class and frequency of group data is given we have to find sample skewness, kurtosis and…
Q: Consider the following Model: y = Bo + B₁x₁ + B₂X₂ + ... + BxXx + ε A) With reference to this model,…
A: Since you have posted a question with multiple sub-parts, we will solve first three subparts for…
Q: (iv) Find the Fisher information in this sample of size n about the parameter 8.
A: It is given that Xi, i = 1,2,......,n follows N(0, θ) (due to form of given pdf), then E(X) = 0 and…
Q: The article refered to in Exercise 1 also considered the effect of gypsum on the electric…
A:
Q: The Turbine Oil Oxidation Test (TOST) and the Rotating Bomb Oxidation Test (RBOT) are two different…
A: Since you have posted a question with multiple sub-parts, we will solve first three subparts for…
Q: An article reports the following values for soil heat flux of eight plots covered with coal dust.…
A: Given that the mean soil heat flux for plots covered only with grass is 29 Claim : The coal dust is…
Q: Temperature transducers of a certain type are shipped in batches of 50. A sample of 60 batches was…
A: “Since you have posted a question with multiple sub-parts, we will solve the first three subparts…
Q: To investigate the question of whether the Brinell hardness of two materials A.and Bis difterent, 10…
A: As per or guidelines,we are allowed to answer first three sub-parts only. Thanks First we will…
Q: 1. The date below are to be used to predict y from x. 1 4 Xi 4 3 3 4 yi 16 12 17 13 22 Assume that…
A:
Q: As a bonus assignment a former student checked if your professor gave a statisticallysignificant…
A: We have to perform Z test for testing the difference in the proportion.
Q: TABLE 12.30 Relationship of bronchial reactivity to So, (cm H,0/s) grouped by lung function at…
A: Here, we use LSD method to compare the means of each pair of groups using Excel as follows: Consider…
Q: Assume that daily evaporation rates (E) have a uniform distribution with a = 0 and b = 0.35…
A: We have given that, daily evaporation rates (E) have a uniform distribution with a = 0 and b = 0.35…
Q: s 4. A labour welfare officer returns the following number of workers observed with certain classes…
A:
1. Calculate the Variance for each lake
2. Plug values into the t-test equation and find 'calculated t'
3. Determine the df and look up 'critical t' with a p-value of 0.05
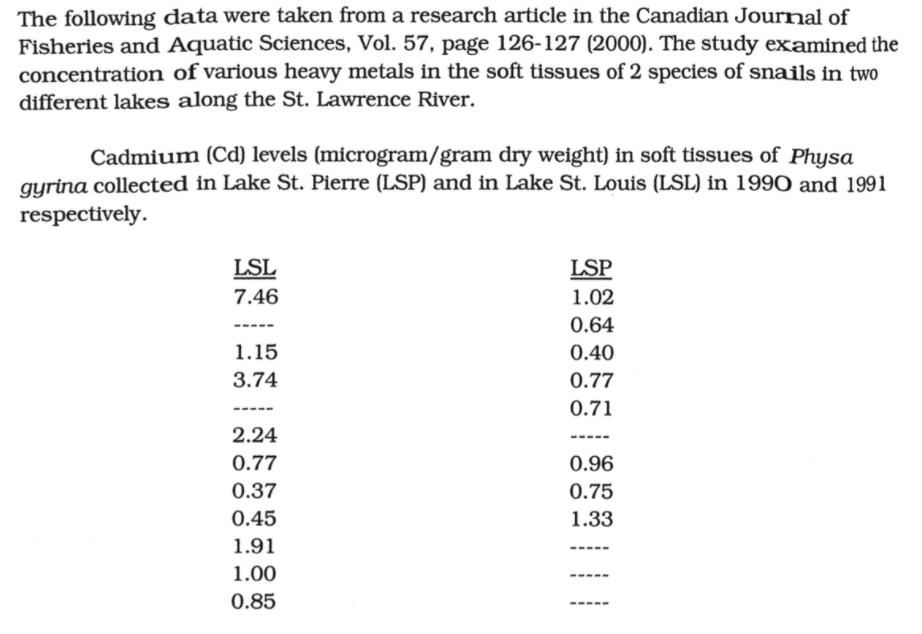
| LSL | LSP | (x-xbar)^2 | (y-ybar)^2 |
| 7.46 | 1.02 | 29.87716 | 0.039006 |
| 1.15 | 0.64 | 0.712336 | 0.033306 |
| 3.74 | 0.4 | 3.048516 | 0.178506 |
| 2.24 | 0.77 | 0.060516 | 0.002756 |
| 0.77 | 0.71 | 1.498176 | 0.012656 |
| 0.37 | 0.96 | 2.637376 | 0.018906 |
| 0.45 | 0.75 | 2.383936 | 0.005256 |
| 1.91 | 1.33 | 0.007056 | 0.257556 |
| 1 | 0.988036 | ||
| 0.85 | 1.308736 |
The mean is given by
- LSL
- LSP
The standard deviation is given by
- LSL
- LSP

Trending now
This is a popular solution!

Step by step
Solved in 2 steps with 11 images


- Here is a dataset containing plant growth measurements of plants grown in solutions of commonly-found chemicals in roadway runoff.Phragmites australis, a fast-growing non-native grass common to roadsides and disturbed wetlands of Tidewater Virginia, was grown in a greenhouse and watered with either: Distilled water (control); A weak petroleum solution (representing standard roadway runoff); Sodium chloride solution; Magnesium chloride solution; De-icing brine (50% sodium chloride and 50% magnesium chloride).Twenty grass preparations were used for each solution, and total growth (in cm) was recorded after watering every other day for 40 days.-Perform the correct statistical test to determine the p-value.-Report your answer rounded to four decimal places.-You should use formulas, functions, and the Data Analysis ToolPak in MS Excel to avoid additive rounding errors. Here are some useful functions: =t.test(array1,array2,tails,type) Produces a p-value for any…The article “Hydrogeochemical Characteristics of Groundwater in a Mid-Western CoastalAquifer System” (S. Jeen, J. Kim, et al., Geosciences Journal, 2001:339–348) presentsmeasurements of various properties of shallow groundwater in a certain aquifer system inKorea. Following are measurements of electrical conductivity (in microsiemens percentimeter) for 23 water samples.2099 528 2030 1350 1018 384 14991265 375 424 789 810 522 513488 200 215 486 257 557 260461 500Find the mean.Find the standard deviation.Find the median.Construct a dotplot.Find the 10% trimmed mean.Find the first quartile.Find the third quartile.Find the interquartile range.Construct a boxplot.Which of the points, if any, are outliers?If a histogram were constructed, would it be skewed to the left, skewed to the right, orapproximately symmetric?An article reported data from a study in which both a baseline gasoline mixture and a reformulated gasoline were used. Consider the following observations on age (yr) and NOx emissions (g/kWh): Engine 1 2 3 4 5 6 7 8 9 10 Age 0 0 2 11 7 16 9 0 12 4 Baseline 1.74 4.38 4.04 1.23 5.30 0.58 3.35 3.44 0.73 1.23 Reformulated 1.85 5.93 5.52 2.67 6.54 0.76 4.94 4.87 0.69 1.39 Construct scatter plots of the baseline NOx emissions versus age. Construct scatter plots of the reformulated NOx emissions versus age. What appears to be the nature of the relationship between these two variables? As age increases, emissions also increase.As age increases, emissions decrease. There is no compelling relationship between the data.
- An article reported data from a study in which both a baseline gasoline mixture and a reformulated gasoline were used. Consider the following observations on age (yr) and NOx emissions (g/kWh): Engine 1 2 3 4 5 6 7 8 9 10 Age 0 0 2 11 7 16 9 0 12 4 Baseline 1.70 4.38 4.06 1.24 5.29 0.59 3.35 3.45 0.73 1.22 Reformulated 1.86 5.91 5.51 2.70 6.50 0.71 4.95 4.86 0.72 1.41 Construct scatter plots of the baseline NOx emissions versus age. What appears to be the nature of the relationship between these two variables? There is no compelling relationship between the data. As age increases, emissions also increase. As age increases, emissions decrease.The article “Effects of Diets with Whole Plant-Origin Proteins Added with Different Ratiosof Taurine:Methionine on the Growth, Macrophage Activity and Antioxidant Capacity ofRainbow Trout (Oncorhynchus mykiss) Fingerlings” (O. Hernandez, L. Hernandez, et al.,Veterinary and Animal Science, 2017:4-9) reports that a sample of 210 juvenile rainbowtrout fed a diet fortified with equal amounts of the amino acids taurine and methionine for aperiod of 70 days had a mean weight gain of 313 percent with a standard deviation of 25, while 210 fish fed with a control diet had a mean weight gain of 233 percent with a standard deviation of 19. Units are percent. Find a 99% confidence interval for the difference in weight gain on the two diets.The spike stature of the plants grown from the seeds of the porcine separates (Dactylis glomerata L) collected from the University campus and İbradı Eynif pasture are given below. In this plant, compare whether there is a difference between regions in terms of spike height. Virgo Height (cm) Data obtained from plants collected from university campus 5 6 8 7 8 6 5 5 4 6 6 Data obtained from plants collected from Eynif pasture 12 9 11 9 9 11 9 10 11 10 Note: Your results interpretation according to two different possibilities (Do it separately, assuming that it is 0.07 and 0.04).
- In an experiment to determine the effect of ambient temperature on the emissons of oxides of nitrogen ( NOx ) of diesel trucks, 10 trucks were run at temperatures of 40°F and 80°F . The emissions, in parts per billion, are presented in the following table. Truck 40°F 80°F 1 926.5 896.7 2 851.1 857.0 3 975.5 952.1 4 1009.3 884.8 5 871.8 840.7 6 949.2 885.1 7 1006.3 885.5 8 836.5 777.8 9 837.8 850.2 10 958.9 882.1 Send data to Excel Let μ1 represent the mean emission at 40°F and =μd−μ1μ2 .Can you conclude that the mean emission differs between the two temperatures? Use the =α0.05 level of significance and the TI-84 Plus calculator to answer the following. p value ? do we reject? is there enough evidence :?rofessor Cornish studied rainfall cycles and sunspot cycles. (Reference: Australian Journal of Physics, Vol. 7, pp. 334-346.) Part of the data include amount of rain (in mm) for 6-day intervals. The following data give rain amounts for consecutive 6-day intervals at Adelaide, South Australia. 7 28 7 1 69 3 1 4 22 7 16 4 54 160 60 73 27 3 3 1 7 144 107 4 91 44 1 8 4 22 4 59 116 52 4 155 42 24 11 43 3 24 19 74 26 63 110 39 34 71 52 39 8 0 15 2 14 9 1 2 4 9 6 10 (i) Find the median. (Use 1 decimal place.)(ii) Convert this sequence of numbers to a sequence of symbols A and B, where A indicates a value above the median and B a value below the median. Test the sequence for randomness about the median at the 5% level of significance. (b) Find the number of runs R, n1, and n2. Let n1 = number of values above the median and n2 = number of values below the median. R n1 n2 (c) In the case, n1 > 20, we cannot use Table 10 of Appendix II to find the critical…A paper investigated the driving behavior of teenagers by observing their vehicles as they left a high school parking lot and then again at a site approximately 1 2 mile from the school. Assume that it is reasonable to regard the teen drivers in this study as representative of the population of teen drivers. Amount by Which Speed Limit Was Exceeded MaleDriver FemaleDriver 1.3 -0.1 1.3 0.4 0.9 1.1 2.1 0.7 0.7 1.1 1.3 1.2 3 0.1 1.3 0.9 0.6 0.5 2.1 0.5 (a) Use a .01 level of significance for any hypothesis tests. Data consistent with summary quantities appearing in the paper are given in the table. The measurements represent the difference between the observed vehicle speed and the posted speed limit (in miles per hour) for a sample of male teenage drivers and a sample of female teenage drivers. (Use μmales − μfemales.Round your test statistic to two decimal places. Round your degrees of freedom down to the nearest whole number. Round your p-value to…
- A paper investigated the driving behavior of teenagers by observing their vehicles as they left a high school parking lot and then again at a site approximately 1 2 mile from the school. Assume that it is reasonable to regard the teen drivers in this study as representative of the population of teen drivers. Amount by Which Speed Limit Was Exceeded MaleDriver FemaleDriver 1.2 -0.1 1.4 0.4 0.9 1.1 2.1 0.7 0.7 1.1 1.3 1.2 3 0.1 1.3 0.9 0.6 0.5 2.1 0.5 (a) Use a .01 level of significance for any hypothesis tests. Data consistent with summary quantities appearing in the paper are given in the table. The measurements represent the difference between the observed vehicle speed and the posted speed limit (in miles per hour) for a sample of male teenage drivers and a sample of female teenage drivers. (Use μmales − μfemales.Round your test statistic to two decimal places. Round your degrees of freedom down to the nearest whole number. Round your p-value to…Consider a cohort study to compare the mortality rate of myocardial infarction (MI) in men with sedentary work (exposed group) to men with physically active work (unexposed). If in the exposed, there were 36,000 person (man) years of observation and 126 deaths whereas the unexposed had 24,000 man-years of observation and 44 deaths. Compute the following a) Mortality rate in each cohort? b) What is the relative risk of dying, comparing these 2 groups? c) What is the attributable risk of sedentary work? d) What is the attributable benefit of physical activity? e) If we assume that MI is associated with the mortality in this cohort (causality), what proportion of the disease in the higher group is potentially preventable?An automotive engineer is investigating two different types of metering devices for an electronic fuel injection system to determine whether they differ in their fuel mileage performance. The system is installed on 10 different cars, and a test is run with each metering device on each car. The data is provided below: Metering Device Car 1 2 1 17.6 16.8 2 19.4 20.0 3 18.2 17.6 4 17.1 16.4 5 15.3 16.0 6 15.9 15.9 7 16.3 16.5 8 18.0 18.4 9 17.3 16.4 10 19.1 20.1 Is there a significant difference between the means of the two metering devices? Use . Interpret the result in the context of the problem. An article in the journal Hazardous Waste and Hazardous Materials (Vol. 6, 1989) reported the results of an analysis of the weight of calcium in standard cement and cement doped with lead. Reduced levels of calcium would indicate that the hydration mechanism in the cement is blocked…
