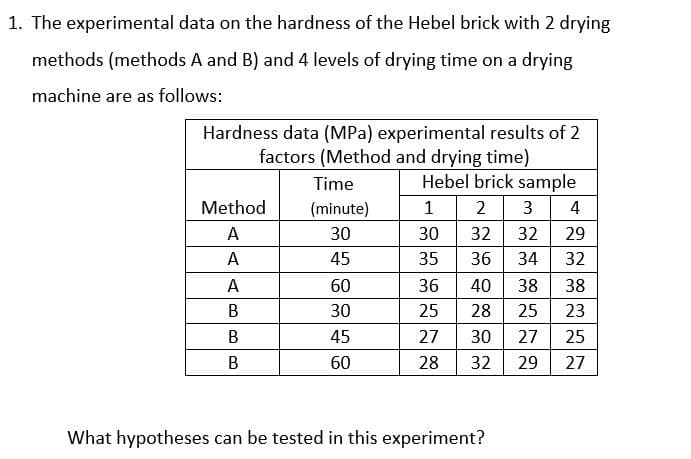
1. The experimental data on the hardness of the Hebel brick with 2 drying methods (methods A and B) and 4 levels of drying time on a drying machine are as follows: Hardness data (MPa) experimental results of 2 factors (Method and drying time) Hebel brick sample Time Method (minute) 1 2 3 4 A 30 30 32 32 29 A 45 35 36 34 32 A 60 36 40 38 38 В 30 25 28 25 23 В 45 27 30 27 25 60 28 32 29 27 What hypotheses can be tested in this experiment?
Q: An expert estimates that the distribution parameter for durability times of parts produced with…
A:
Q: For this experiment, it is desired to investigate the relationship between air inlet temperature and…
A: Consider the given data that contains the intel temperature (x) and the removal efficiency (y).…
Q: Given data: The following is a list of scores resulting from an English examination administered to…
A: Statistics is the branch of applied Mathematics in which we do collection, analysis, interpretation…
Q: 1. The efficiency ratio for a steel specimen immersed in a phosphating tank is the weight of the…
A: Given :The weight of the phosphate coating divided b the metal loss (both in mg/ft2 ).a) Now we may…
Q: 7. In 2010 consumption (Ci) for selected countries was as follows Jordan 2.5 billion $, USA 100…
A:
Q: 5.1 Byers and Williams (Viscosities of Binary and Ternary Mixtures of Polyaromatic Hydrocarbons,"…
A: Given Information: Consider the given data: Temperature Viscosity 24.9 1.133 35 0.9772…
Q: The following are data on the ages and incomes of a random sample of 5 executives working for XYZ…
A: Regression: The regression analysis is conducted here by using EXCEL. The software procedure is…
Q: 9(a). Suppose that in the "water and plant growth height" example we have four plants in the…
A: The following information has been given: 9(a.) x y 1 6.4 2 6.6 3 7.6 4 9.4 9(b.)…
Q: The following data show the results of random sample of 10 batches of one pattern of product:…
A:
Q: For this experiment, it is desired to investigate the relationship between air inlet temperature and…
A: As per guidelines we will solve the first question only, please repost other questions for more…
Q: A chemical product has 3 layers: substrate (X₁), active layer (X₂), and coating layer (X3). A…
A:
Q: Exercise 4.1 The number of defects on the front side (X) of a wooden panel and the number of defects…
A: The joint p.m.f. is given by: fxy(x,y) = c (x+y) where, x = 1,2,3 and y = 1,2,3
Q: . Consider the following models: (1) Y = B1 + B2X +u (2) Y* = a, + a,X; + u lere X and Y are…
A: Given information: The two regression models are as given below:
Q: The article "Characterization of Effects of Thermal Property of Aggregate on the Carbon Footprint of…
A: Given CO2 emissions at various temperature Temperature Emissions 160 9.52 14.1 7.43…
Q: 4. A material used in the construction industry contains an impurity suspected of having an adverse…
A: x p=(x-250)/50 y Δy Δ2y Δ3y Δ4y Δ5y Δ6y 100 -3 10.63 2.4…
Q: 2. (2) Consider the wage equation In(wage) A+BEDUC + B,EDUC +B,EXPER+B,EXPER+B.(EDUC EXPER)+e where…
A: "Since you have posted a question with multiple sub-parts, we will solve the first three sub-parts…
Q: Exercise 4.1 The number of defects on the front side (X) of a wooden panel and the number of defects…
A: Hello! As you have posted more than 3 sub parts, we are answering the first 3 sub-parts. In case…
Q: What type of experiment is typically used to estimate the parameters of the model: y-bo…
A: The option 3 is correct. i.e. None of the shown options.
Q: In Exercises 37–42, find ||v|| and find the unit vector in the direction of v. 37. v = (3, –4) 38. v…
A: 37). Given vector is v=3,-4. To find v and find the unit vector in the direction of v. Solution: We…
Q: A manufacturer of automobile transmissions uses two different processes. Management ordered a study…
A: a) Given that there are two processes and total number of observations is 20. Degrees of freedom for…
Q: Statistics Multiple R R Square Adjusted R Sq ? Standard Error ? Observations 15 ANOVA df SS MS…
A: 2.Areal estate company wants to study the relationship between Home price (in OMR 1000) and the…
Q: The Turbine Oil Oxidation Test (TOST) and the Rotating Bomb Oxidation Test (RBOT) are two different…
A: From given data, X Y X*Y X*X Y*Y 4200 370 1554000 17640000 136900 3600 340 1224000 12960000…
Q: 4.28 Suppose that samples of polythene bags from two manufacturers A and B are tested by a buyer for…
A:
Q: 9. The following table shows the number of bacteria colonies present in each of several petri…
A: a) The hypotheses are;
Q: 7. Consider the two data sets 41 and X 2 [3 [1 X = 5 4 5 7 for which [2] 31 = | 4 5 and [1 S pooled…
A: Given: X1=124535& X2=324957x1=24, x2=35& Spooled=1112
Q: 7. A certain raw material is classified as to moisture content X (in percent) and impurity Y (in…
A: "Since you have asked multiple questions, we will solve the first question for you. If you want any…
Q: The thermal conductivity (R-Value) of 23 samples of newly developed inulating material follows:…
A: Solution: Let X be the thermal conductivity. From the given information, the confidence level is…
Q: 2.890 A consumer buying cooperative tested the effective heating area of 20 different electric space…
A: The independent variable is Wattage. The dependent variable is Area. We have to do correlation and…
Q: = 1, 2, 3, and 4 respectively.) 1.6: 59.9 53.5 56.7 63.2 58.6 3.8: 55.6 59.6 52.6 54.5 6.0: 51.2…
A: We want find the value of F and p value.
Q: Exercise 4.1 The number of defects on the front side (X) of a wooden panel and the number of defects…
A: Joint Probability Distribution: Let X and Y be two discrete random variables defined over the sample…
Q: 5. The following table lists the tensile strengths of a rubber compound produced by three different…
A: Note: Hi, thank you for the question. As per our company guideline we are supposed to answer only…
Q: Method A X1 = 7.72 S1 = 0.67 n1 = 17 %3D Method B X2 = 6.21 %3D S2 = 0.51 %3D n2 = 25 %3D i)…
A: Given that, Method A: x1¯=7.72, s1=0.67, n1=17 Method B: x2¯=6.21, s2=0.51, n2=25
Q: A 2 X 2 ANOVA experiment produces Select one: a. one overall F ratio followed by a series of…
A: Summary table for two-way ANOVA: Source of variation Sum of Square degrees of freedom Mean Sum of…
Q: Assume a univariate quantitative data set, which contains fifty observations, has been organized by…
A: From the given information, cf1=9rf2=0.04f3=1 There are 50 observations. By adding 20 more…
Q: Consider the following Cobb-Douglas production function for the bus transportation system in a city:…
A: A. Returns to scale measure how much addition output will be obtained when all factors change…
Q: Where did the Day 0 sample come from? Day 2 Growth Day 3 Day 1 Growth Growth Surface Area Surface…
A: Given information: Where did the sample come from? Day 0 Day 1 Day 2 Day 3 Quadrant 1 Control…
Q: An article contained the following observations on degree of polymerization for paper specimens for…
A: Box plot: Step-by-step procedure to draw the box plot using EXCEL software: Select the data and…
Q: The Turbine Oil Oxidation Test (TOST) and the Rotating Bomb Oxidation Test (RBOT) are two different…
A: Since you have posted a question with multiple sub-parts, we will solve first three subparts for…
Q: 3. A manufacturer of paper used for making grocery bags is interested in improving the tensile…
A: There are 4 independent samples which are 4 types of hardwood concentrations. We have to test…
Q: 1. The average normal daily temperature ( in degree Celsius) and the corresponding average monthly…
A:
Q: Temperature transducers of a certain type are shipped in batches of 50. A sample of 60 batches was…
A: “Since you have posted a question with multiple sub-parts, we will solve the first three subparts…
Q: 1. A report in LTO stated that the average age of taxis in the Philippines is 9 years. An operations…
A:
Q: 10 9 8 8 Determine the kurtosis if the data given is a sample. Use 4 decimal places. 8 7 7 5 2
A: x x2 (x-x¯)4 1 1 915.06 2 4 410.06 5 25 5.06 7 49 0.06 7 49 0.06 8 64 5.06 8 64 5.06…
Q: An expert estimates that the distribution parameter for durability times of parts produced with…
A:
Q: The article "Oxidation State and Activities of Chromium Oxides in Cao-SiO,-CrO, Slag System" (Y.…
A: Hey there! Thank you for posting the question. Since your question has more than 3 parts, we are…
Q: The thermal conductivity (R-Value) of 23 samples of newly developed inulating material follows:…
A: The confidence interval formula for the one-sided lower limit is, x¯-tα,dfsn≤μ In the formula x¯ is…
Q: 8. please have all 6 steps of the p method listed clearly! Truck pollution: In an experiment to…
A: We are recording the data twice for the same subject. Hence, we will use Paired sample test Given…
Step by step
Solved in 3 steps
- In the article “Groundwater Electromagnetic Imaging in Complex Geological and Topographical Regions: A Case Study of a Tectonic Boundary in the French Alps” (S. Houtot, P. Tarits, et al., Geophysics, 2002:1048–1060), the pH was measured for several water samples in various locations near Gittaz Lake in the French Alps. The results for 11 locations on the northern side of the lake and for 6 locations on the southern side are as follows: Northern side: 8.1 8.2 8.1 8.2 8.2 7.4 7.3 7.4 8.1 8.1 7.9 Southern side: 7.8 8.2 7.9 7.9 8.1 8.1 Find a 98% confidence interval for the difference in pH between the northern and southern side.The Turbine Oil Oxidation Test (TOST) and the Rotating Bomb Oxidation Test (RBOT) are two different procedures for evaluating the oxidation stability of steam turbine oils. An article reported the accompanying observations on x = TOST time (hr) and y = RBOT time (min) for 12 oil specimens. TOST 4200 3600 3750 3650 4050 2770 RBOT 370 345 375 315 350 205 TOST 4870 4525 3450 2700 3750 3325 RBOT 400 380 285 220 345 290 (a) Calculate the value of the sample correlation coefficient. (Round your answer to four decimal places.) r = Carry out a test of hypotheses to decide whether RBOT Time and TOST time are linearly related. (Use ? = 0.05.) Calculate the test statistic and determine the P-value. (Round your test statistic to two decimal places and your P-value to three decimal places.) t = P-value =A consumer buying cooperative tested the effective heating area of 20 different electric space heaters with different wattages. Here are the results. Heater Wattage Area 1 1,000 108 2 750 291 3 1,500 100 4 1,000 43 5 1,250 68 6 1,500 181 7 1,250 254 8 750 228 9 1,500 126 10 1,500 166 11 750 45 12 750 237 13 1,000 75 14 1,750 126 15 1,750 249 16 1,750 105 17 1,750 298 18 1,250 212 19 750 98 20 750 185 Click here for the Excel Data File a. Compute the correlation between the wattage and heating area. Is there a direct or an indirect relationship? (Round your answer to 4 decimal places.) b. Conduct a test of hypothesis to determine if it is reasonable that the coefficient is greater than zero. Use the 0.050 significance level. (Round intermediate calculations and final answer to 3 decimal places.)H0: ρ ≤ 0; H1: ρ > 0 Reject H0 if t > 1.734…
- A consumer buying cooperative tested the effective heating area of 20 different electric space heaters with different wattages. Here are the results. Heater Wattage Area 1 1,000 290 2 750 292 3 1,500 148 4 1,250 246 5 1,250 203 6 750 85 7 1,250 237 8 1,000 139 9 1,500 64 10 1,000 171 11 1,750 163 12 1,250 175 13 750 264 14 1,500 50 15 1,750 163 16 1,500 177 17 1,250 118 18 1,750 122 19 1,000 144 20 1,500 103 Click here for the Excel Data File Compute the correlation between the wattage and heating area. Is there a direct or an indirect relationship? (Round your answer to 4 decimal places.) Conduct a test of hypothesis to determine if it is reasonable that the coefficient is greater than zero. Use the 0.025 significance level. (Round intermediate calculations and final answer to 3 decimal places.) H0: ρ ≤ 0; H1: ρ > 0 Reject H0 if t…In an experiment to determine the effect of ambient temperature on the emissons of oxides of nitrogen ( NOx ) of diesel trucks, 10 trucks were run at temperatures of 40°F and 80°F . The emissions, in parts per billion, are presented in the following table. Truck 40°F 80°F 1 926.5 896.7 2 851.1 857.0 3 975.5 952.1 4 1009.3 884.8 5 871.8 840.7 6 949.2 885.1 7 1006.3 885.5 8 836.5 777.8 9 837.8 850.2 10 958.9 882.1 Send data to Excel Let μ1 represent the mean emission at 40°F and =μd−μ1μ2 .Can you conclude that the mean emission differs between the two temperatures? Use the =α0.05 level of significance and the TI-84 Plus calculator to answer the following. p value ? do we reject? is there enough evidence :?A dietitian wishes to see if a person’s cholesterol level will be changed if the diet is supplemented by a certain mineral. Four subjects were pre-tested, and they took the mineral supplement for a 6-week period. The results are shown in the table. Is there sufficient evidence to conclude that the population mean of cholesterol levels has been changed after six weeks at α=0.2α=0.2? Assume that the differences are from an approximately normally distributed population. Subject Cholestrol Level (mg/dl) Cholestrol Level after 6 Weeks (mg/dl) dd ¯dd¯ (d−¯d)2(d-d¯)2 1 206 217 11 2 219 184 -35 3 202 204 2 4 213 205 -8 Total -30 a) Calculate the mean, the sum of the squared deviation from the mean, and the standard deviation of differences. Do not include the unit for each answer: ¯d=d¯= (do not round) ∑(d−¯d)2=∑(d-d¯)2= (do not round) sd=sd= (rounded to one decimal place) b) Perform the hypothesis test in the following steps: Step 1.…
- Here is a dataset containing plant growth measurements of plants grown in solutions of commonly-found chemicals in roadway runoff.Phragmites australis, a fast-growing non-native grass common to roadsides and disturbed wetlands of Tidewater Virginia, was grown in a greenhouse and watered with either: Distilled water (control); A weak petroleum solution (representing standard roadway runoff); Sodium chloride solution; Magnesium chloride solution; De-icing brine (50% sodium chloride and 50% magnesium chloride).Twenty grass preparations were used for each solution, and total growth (in cm) was recorded after watering every other day for 40 days.-Perform the correct statistical test to determine the p-value.-Report your answer rounded to four decimal places.-You should use formulas, functions, and the Data Analysis ToolPak in MS Excel to avoid additive rounding errors. Here are some useful functions: =t.test(array1,array2,tails,type) Produces a p-value for any…37- An expert estimates that the distribution parameter for durability times of parts produced with machine A in the factory is different from the distribution parameter for durability times of parts produced with machine B. Durability times of 7 parts produced from machine A and 7 parts produced from machine B are given below. Accordingly, find the Mann Whitney U critical table value required to test the expert's claim at a = 0.05 significance level. a) 12 B) 14 c) 16 D) 18 e) 21The performance of two analysts in determining total mercury (mg / kg) in fish was evaluated using the absorption spectrometry method. The results on the concentrations of mercury found in fish, for each analyst, are presented in the table below: Analyst 1 Analyst 2 7 12 9 8 6 9 11 13 13 14 8 9 7 8 13 10 12 7 9 15 (a)Is the performance in determining total mercury for Analyst 1 more accurate than Analyst 2? Compare the accuracy in the results of the two analysts at a 95% confidence level. Explain. (b)Are the results obtained by the two analysts, in the concentrations of mercury found in the fish, statistically equivalent, with 95% confidence? Explain
- The management of BCD Inc. would like to separate the fixed and variable components of electricity as measured against machine hours in one of its plants. Data collected over the most recent six months follow:Electricity MachineMonth Cost Hours January $1,100 4,500February 1,110 4,700March 1,050 4,100April 1,200 5,000May 1,060 4,000June 1,120 4,600Required: 1. Using the method of least squares, compute the fixed cost and the variable cost rate for electricity expense. (Round estimates to the nearest cent.) 2. Compute coefficients of correlation and determination2- An expert estimates that the distribution parameter for durability times of parts produced with machine A in the factory is different from the distribution parameter for durability times of parts produced with machine B. Durability times of 4 parts produced from machine A and 4 parts produced from machine B are given below. Find the Mann-Whitney U value by using these data. a) 18 B) 6 NS) 16 D) 20 TO) 1237// An expert estimates that the distribution parameter for durability times of parts produced with machine A in the factory is different from the distribution parameter for durability times of parts produced with machine B. Durability times of 7 parts produced from machine A and 7 parts produced from machine B are given below. Accordingly, find the Mann Whitney U critical table value required to test the expert's claim at a = 0.05 significance level. a) 12 B) 14 NS) 16 D) 18 TO) 21