1. Data are collected in a clinical trial evaluating a new compound designed to improve wound healing in trauma patients. The new compound is compared against a placebo. After treatment for 5 days with the new compound or placebo, the extent of wound heal- ing is measured and the data are shown in Table 7-6. Is there a difference in the extent of wound healing by TABLE 7-6 Data for Practice Problems 1 and 2 Percent Wound Healing 0-25% 26-50% 51-75% 76-100% Treatment New compound (n= 125) 15 37 32 41 Placebo (n= 125) 36 45 34 10
1. Data are collected in a clinical trial evaluating a new compound designed to improve wound healing in trauma patients. The new compound is compared against a placebo. After treatment for 5 days with the new compound or placebo, the extent of wound heal- ing is measured and the data are shown in Table 7-6. Is there a difference in the extent of wound healing by TABLE 7-6 Data for Practice Problems 1 and 2 Percent Wound Healing 0-25% 26-50% 51-75% 76-100% Treatment New compound (n= 125) 15 37 32 41 Placebo (n= 125) 36 45 34 10

MATLAB: An Introduction with Applications
6th Edition
ISBN:9781119256830
Author:Amos Gilat
Publisher:Amos Gilat
Chapter1: Starting With Matlab
Section: Chapter Questions
Problem 1P

Related questions
Topic Video
Question
100%
Please share an excel screen on how to input and calculate the data for #1 only.
Thank you
Transcribed Image Text:Fo 9781284108217_WOBK_Excel200 x
PoF lassa-fever-introduction.pdf
x |+
PDF
O File | C:/Users/srhow/AppData/Local/Temp/Temp3_9781284108217_WOBK_FULL.zip/9781284108217_WOBK_Excel2007.pdf
...
Imported. O GodlywoodGirl
C * StoreFrontier | Crea.
Mailchimp
Canva O HP Instant Ink | HP.
RA Faith Driven Life
(Mw) Dictionary by Merri.
bp My Account info
O Imported from Chr.
+
(D Page view | A Read aloud V Draw
F Highlight
O Erase
111
of 231
-
106
Hypothesis Testing Procedures
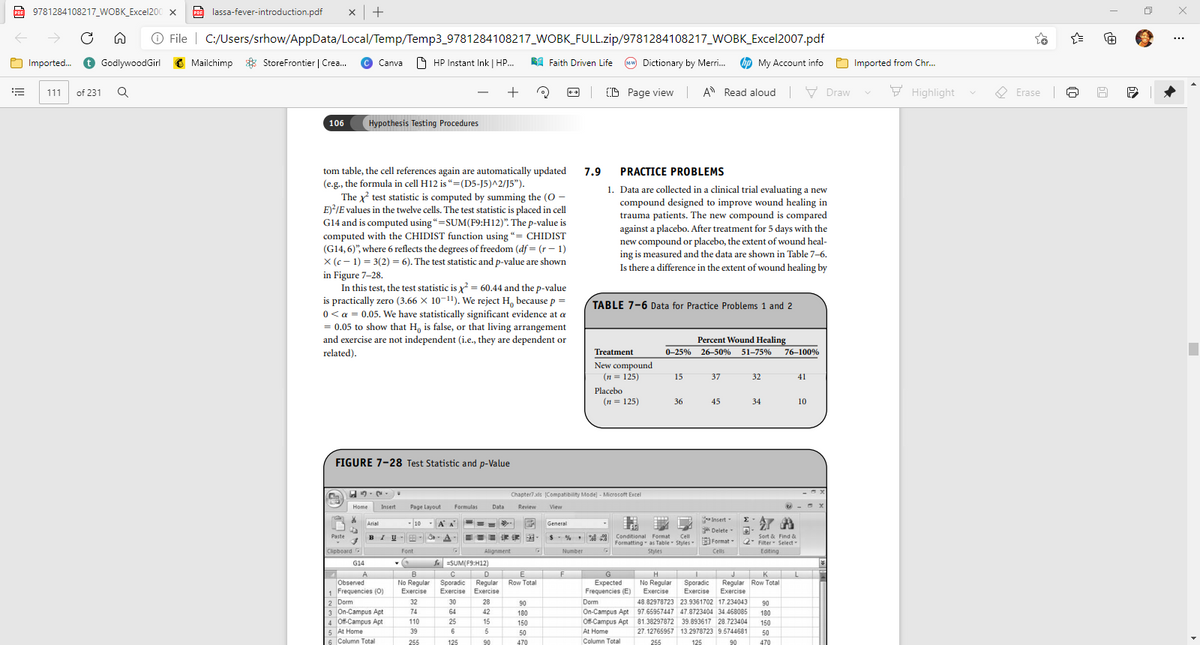
tom table, the cell references again are automatically updated
(e.g., the formula in cell H12 is "=(D5-J5)^2/J5").
The x test statistic is computed by summing the (0 -
E)?/E values in the twelve cells. The test statistic is placed in cell
G14 and is computed using“=SUM(F9:H12)". The p-value is
computed with the CHIDIST function using "= CHIDIST
(G14, 6)", where 6 reflects the degrees of freedom (df = (r– 1)
X (c - 1) = 3(2) = 6). The test statistic and p-value are shown
in Figure 7-28.
In this test, the test statistic is x² = 60.44 and the p-value
is practically zero (3.66 X 10-!), We reject H because p =
0 < a = 0.05. We have statistically significant evidence at a
= 0.05 to show that H, is false, or that living arrangement
and exercise are not independent (i.e., they are dependent or
7.9
PRACTICE PROBLEMS
1. Data are collected in a clinical trial evaluating a new
compound designed to improve wound healing in
trauma patients. The new compound is compared
against a placebo. After treatment for 5 days with the
new compound or placebo, the extent of wound heal-
ing is measured and the data are shown in Table 7–6.
Is there a difference in the extent of wound healing by
TABLE 7-6 Data for Practice Problems 1 and 2
Percent Wound Healing
related).
Treatment
26-50% 51-75%
76-100%
New compound
(n = 125)
Placebo
15
37
32
41
(n = 125)
36
45
34
10
FIGURE 7-28 Test Statistic and p-Value
Chapter7 xls (Compatibility Mode) - Microsoft Excel
Home
Insert
Page Layout
Formulas
Data
Review
View
Insert
* Delete
即Format
的
Σ
Arial
- 10
A A
General
BIU-ER
Conditional Format
Formatting - as Table Styles
Sort & Find &
2 Filter Select
Paste
BIU
Cell
Clipboard
Font
Alignment
Number
Styles
Cells
Editing
SUM(F9:H12)
C D E
Sporadic
Exercise Exercise
G14
J
Sporadic
Exercise
K L
Regular Row Total
Exercise
B
G
H
No Regular
Exercise
Row Total
Observed
1 Frequencies (0)
2 Dorm
3 On-Campus Apt
4 Off-Campus Apt
5 At Home
6 Column Total
Regular
Expected
Frequencies (E)
No Regular
Exercise
32
30
28
90
Dorm
48.82978723 23.9361702 17.234043
90
On-Campus Apt 97.65967447 47.8723404 34.468085
Of-Campus Apt 81.38297872 39.893617 28.723404
At Home
74
64
42
180
180
110
25
15
150
150
39
6
50
27.12765957 13.2978723 9.5744681
50
255
125
90
479
Column Total
255
125
479
Transcribed Image Text:A 9781284108217_WOBK_Excel200 x
O lassa-fever-introduction.pdf
x |+
PDF
O File | C:/Users/srhow/AppData/Local/Temp/Temp3_9781284108217_WOBK_FULL.zip/9781284108217_WOBK_Excel2007.pdf
...
Imported. O GodlywoodGirl
C Mailchimp * StoreFrontier | Crea.
© Canva HP Instant Ink | HP.
RA Faith Driven Life
Mw Dictionary by Merri.
bp My Account info
O Imported from Chr.
+
O Page view A Read aloud V Draw
F Highlight
O Erase
112
of 231
Practice Problems
107
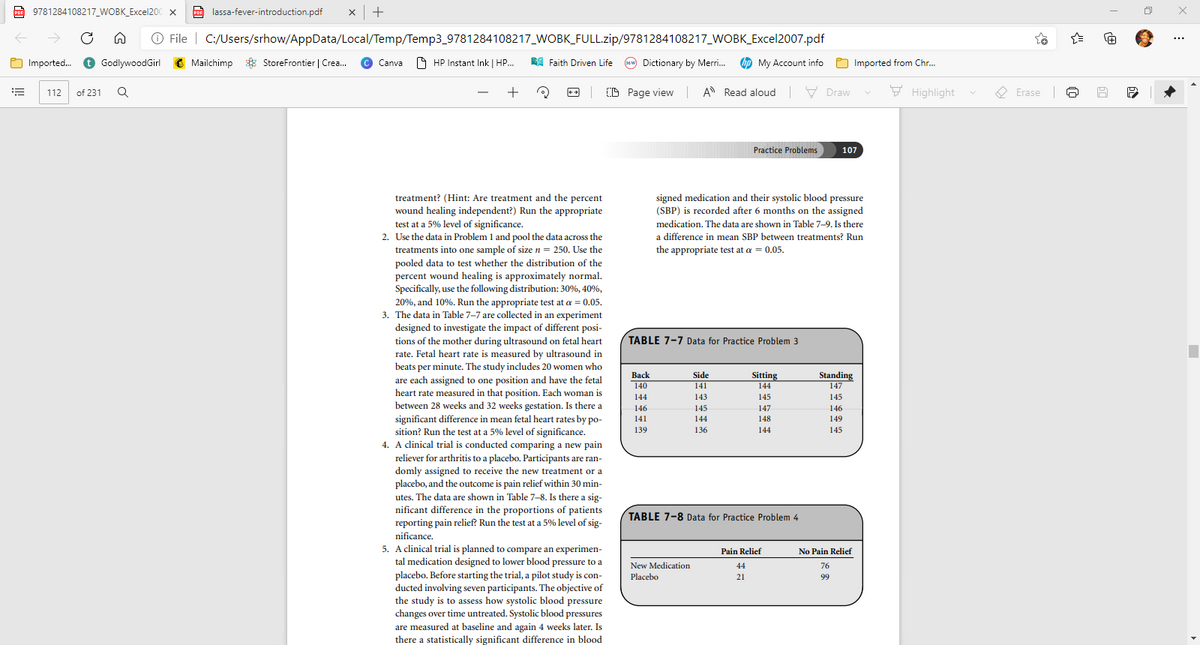
treatment? (Hint: Are treatment and the percent
wound healing independent?) Run the appropriate
test at a 5% level of significance.
2. Use the data in Problem 1 and pool the data across the
treatments into one sample of size n = 250. Use the
pooled data to test whether the distribution of the
percent wound healing is approximately normal.
Specifically, use the following distribution: 30%, 40%,
signed medication and their systolic blood pressure
(SBP) is recorded after 6 months on the assigned
medication. The data are shown in Table 7-9. Is there
a difference in mean SBP between treatments? Run
the appropriate test at a = 0.05.
20%, and 10%. Run the appropriate test at a = 0.05.
3. The data in Table 7-7 are collected in an experiment
designed to investigate the impact of different posi-
tions of the mother during ultrasound on fetal heart
rate. Fetal heart rate is measured by ultrasound in
beats per minute. The study includes 20 women who
TABLE 7-7 Data for Practice Problem 3
Вack
Side
Sitting
Standing
147
are each assigned to one position and have the fetal
heart rate measured in that position. Each woman is
between 28 weeks and 32 weeks gestation. Is there a
significant difference in mean fetal heart rates by po-
sition? Run the test at a 5% level of significance.
4. A clinical trial is conducted comparing a new pain
reliever for arthritis to a placebo. Participants are ran-
domly assigned to receive the new treatment or a
placebo, and the outcome is pain relief within 30 min-
utes. The data are shown in Table 7-8. Is there a sig-
nificant difference in the proportions of patients
reporting pain relief? Run the test at a 5% level of sig-
140
141
144
144
143
145
145
146
145
147
146
141
144
148
149
139
136
144
145
TABLE 7-8 Data for Practice Problem 4
nificance.
5. A clinical trial is planned to compare an experimen-
tal medication designed to lower blood pressure to a
placebo. Before starting the trial, a pilot study is con-
ducted involving seven participants. The objective of
the study is to assess how systolic blood pressure
changes over time untreated. Systolic blood pressures
are measured at baseline and again 4 weeks later. Is
there a statistically significant difference in blood
Pain Relief
No Pain Relief
New Medication
44
76
Placebo
21
99
Expert Solution
This question has been solved!
Explore an expertly crafted, step-by-step solution for a thorough understanding of key concepts.

This is a popular solution!

Trending now
This is a popular solution!

Step by step
Solved in 2 steps with 1 images

Knowledge Booster


Learn more about
Need a deep-dive on the concept behind this application? Look no further. Learn more about this topic, statistics and related others by exploring similar questions and additional content below.Recommended textbooks for you
MATLAB: An Introduction with Applications
Statistics
ISBN:
9781119256830
Author:
Amos Gilat
Publisher:
John Wiley & Sons Inc

Probability and Statistics for Engineering and th…
Statistics
ISBN:
9781305251809
Author:
Jay L. Devore
Publisher:
Cengage Learning

Statistics for The Behavioral Sciences (MindTap C…
Statistics
ISBN:
9781305504912
Author:
Frederick J Gravetter, Larry B. Wallnau
Publisher:
Cengage Learning
MATLAB: An Introduction with Applications
Statistics
ISBN:
9781119256830
Author:
Amos Gilat
Publisher:
John Wiley & Sons Inc
Probability and Statistics for Engineering and th…
Statistics
ISBN:
9781305251809
Author:
Jay L. Devore
Publisher:
Cengage Learning
Statistics for The Behavioral Sciences (MindTap C…
Statistics
ISBN:
9781305504912
Author:
Frederick J Gravetter, Larry B. Wallnau
Publisher:
Cengage Learning

Elementary Statistics: Picturing the World (7th E…
Statistics
ISBN:
9780134683416
Author:
Ron Larson, Betsy Farber
Publisher:
PEARSON

The Basic Practice of Statistics
Statistics
ISBN:
9781319042578
Author:
David S. Moore, William I. Notz, Michael A. Fligner
Publisher:
W. H. Freeman

Introduction to the Practice of Statistics
Statistics
ISBN:
9781319013387
Author:
David S. Moore, George P. McCabe, Bruce A. Craig
Publisher:
W. H. Freeman