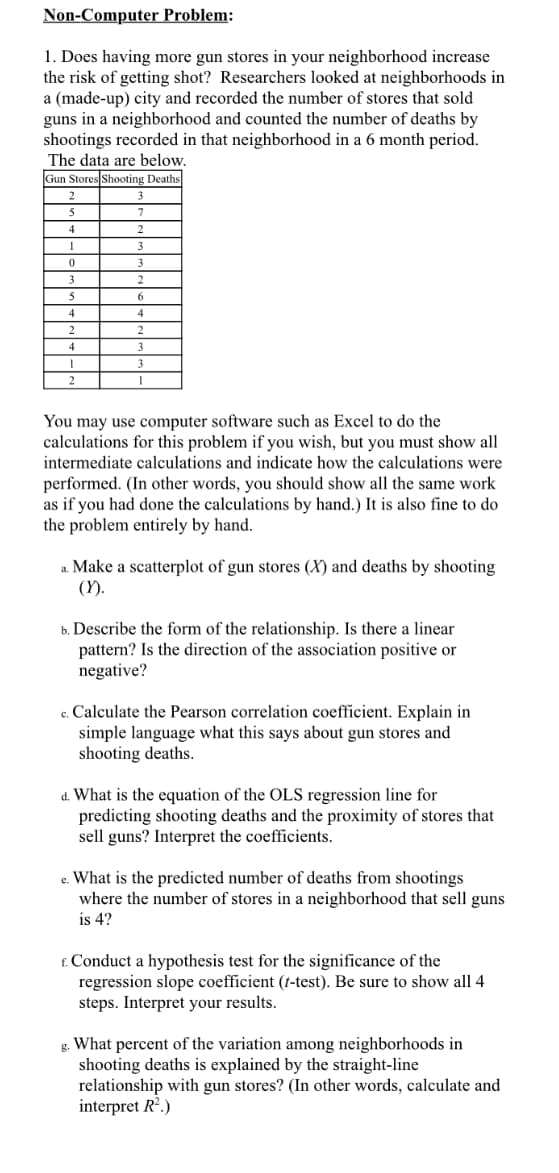
1. Does having more gun stores in your neighborhood increase the risk of getting shot? Researchers looked at neighborhoods in a (made-up) city and recorded the number of stores that sold guns in a neighborhood and counted the number of deaths by shootings recorded in that neighborhood in a 6 month period. The data are below. Gun Stores Shooting Deaths 2 3 5 7 4 3 3 4 4 2 4 3 You may use computer software such as Excel to do the calculations for this problem if you wish, but you must show all intermediate calculations and indicate how the calculations were performed. (In other words, you should show all the same work as if you had done the calculations by hand.) It is also fine to do the problem entirely by hand. a. Make a scatterplot of gun stores (X) and deaths by shooting (Y). b. Describe the form of the relationship. Is there a linear pattern? Is the direction of the association positive or negative? c. Calculate the Pearson correlation coefficient. Explain in simple language what this says about gun stores and shooting deaths.
1. Does having more gun stores in your neighborhood increase the risk of getting shot? Researchers looked at neighborhoods in a (made-up) city and recorded the number of stores that sold guns in a neighborhood and counted the number of deaths by shootings recorded in that neighborhood in a 6 month period. The data are below. Gun Stores Shooting Deaths 2 3 5 7 4 3 3 4 4 2 4 3 You may use computer software such as Excel to do the calculations for this problem if you wish, but you must show all intermediate calculations and indicate how the calculations were performed. (In other words, you should show all the same work as if you had done the calculations by hand.) It is also fine to do the problem entirely by hand. a. Make a scatterplot of gun stores (X) and deaths by shooting (Y). b. Describe the form of the relationship. Is there a linear pattern? Is the direction of the association positive or negative? c. Calculate the Pearson correlation coefficient. Explain in simple language what this says about gun stores and shooting deaths.

Chapter7: Matrices And Determinants
Section7.2: Operations With Matrices
Problem 12ECP

Related questions

Question
Transcribed Image Text:Non-Computer Problem:
1. Does having more gun stores in your neighborhood increase
the risk of getting shot? Researchers looked at neighborhoods in
a (made-up) city and recorded the number of stores that sold
guns in a neighborhood and counted the number of deaths by
shootings recorded in that neighborhood in a 6 month period.
The data are below.
Gun Stores Shooting Deaths
3
5
7
2
3
3
4
3
You may use computer software such as Excel to do the
calculations for this problem if you wish, but you must show all
ntermediate calculati
performed. (In other words, you should show all the same work
as if you had done the calculations by hand.) It is also fine to do
the problem entirely by hand.
and indicate
the calculations were
a. Make a scatterplot of gun stores (X) and deaths by shooting
(Y).
b. Describe the form of the relationship. Is there a linear
pattern? Is the direction of the association positive or
negative?
c. Calculate the Pearson correlation coefficient. Explain in
simple language what this says about gun stores and
shooting deaths.
d. What is the equation of the OLS regression line for
predicting shooting deaths and the proximity of stores that
sell guns? Interpret the coefficients.
e. What is the predicted number of deaths from shootings
where the number of stores in a neighborhood that sell guns
is 4?
f. Conduct a hypothesis test for the significance of the
regression slope coefficient (t-test). Be sure to show all 4
steps. Interpret your results.
g. What percent of the variation among neighborhoods in
shooting deaths is explained by the straight-line
relationship with gun stores? (In other words, calculate and
interpret R.)
Expert Solution
This question has been solved!
Explore an expertly crafted, step-by-step solution for a thorough understanding of key concepts.

This is a popular solution!

Trending now
This is a popular solution!

Step by step
Solved in 4 steps with 2 images

Knowledge Booster


Learn more about
Need a deep-dive on the concept behind this application? Look no further. Learn more about this topic, statistics and related others by exploring similar questions and additional content below.Recommended textbooks for you