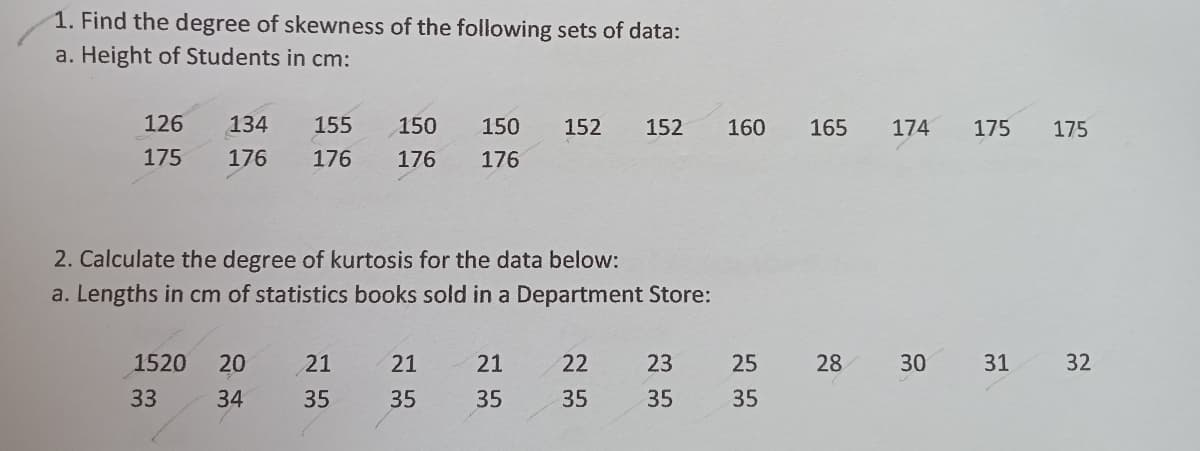
1. Find the degree of skewness of the following sets of data: a. Height of Students in cm: 126 134 155 150 150 152 152 160 165 174 175 175 175 176 176 176 176


Q: a. Three fertilizer treatments, A, B, C, each applied to seven plots of strawberry plants, resulted…
A: The method Analysis of variance is used to determine the significant mean difference between 3 or…
Q: The following are the heights of a father and his eldest son, in inches: Height of the Father 71 69…
A:
Q: How strongly do physical characteristics of sisters and brothers correlate? Provided are data on the…
A: Given Information: Brother (X) 71 68 66 67 70 71 70 73 72 65 66 70 Sister (Y) 69 64 65 63 65 62…
Q: Determine the median of the given data set. Height 148 153 167 138 170 153 165 175 (cm)
A: Median: It represents the middle value for any given data set. There are two cases arises.…
Q: Calculate the coefficient of skewness from the following data : e'noerse he Mid-point : Frequency :…
A:
Q: Answer the following questions given the parallel box plots. c. Which company has the greatest IQR?…
A: we know range is maximum minus minimum, a) Answer : Company B has the largest range. b) Answer :…
Q: Use the line of best fit to predict the record pole vault height for the 2008 Olympics. Year Height…
A: Given Solution:
Q: The following is data for the first and second Quiz scores for 8 students in a class. First Quiz…
A: We first plot the points (11,10), (18,18), (19,18), (23,22), (28,25), (29, 26), (32, 27), (42, 37)
Q: Use the following box plots to answer questions 5 and 6. Here are two box plots: 95 100 105 110 115…
A: 5. The median is represented by middle bar in the box of the given box plot. So, from the two…
Q: Use the dot plot to answer the following questions. How many students were surveyed? ¿Cuántos…
A: We have to use the dot plot
Q: The following pictograph shows the approximate attendance at four Big Sky High School winter…
A: Pictograph is a pictorial representation of data using symbols. The given pictograph is Here, each…
Q: In a pair of similar triangles, corresponding medians are proportional. True O False
A: topic - similar triangles in similar triangles, corresponding medians are proportional
Q: The following is data for the first and second Quiz scores for 8 students in a class. First Quiz…
A:
Q: The following data are the measures of the diameters of 36 rivet heads in millimetres 170.69…
A: Given data represents the measures of the diameters of 36 rivet heads in millimetres .…
Q: STATE: How heavy a load (in pounds) is needed to pull apart pieces of Douglas fir 4 inches long and…
A: To find: 98% confidence interval Population standard deviation = 3000 Sample size (n) = 20
Q: Using the scatter plot provided, list all of the ordered pairs plotted. 320 300 280 260 240 220 200…
A: Given query is to find plotted pairs.
Q: 1. The data betouL represents the heights (cm) of 20 boys 140 138 133 148 160 153 131 146 134 136…
A: Disclaimer : “Since you have posted a question with multiple sub-parts, we will solve first three…
Q: The following table lists workers paid by a piece rate. Fill in the missing values from the table…
A: Here, we will use the formula:Total Pay=Rate per item ×Number of items .....1
Q: The following data give the speeds of 13 cars, measured by radar, travel 73 75 69 68 78 69 74 76 72…
A: A quartile is a statistical term that describes a division of observations into four defined…
Q: Use descriptions of shape, center, and spread to compare the distribution of calories in adult and…
A: We are given the two graphs of distribution of calories in adult and child cereals and we have to…
Q: The following is data for the first and second Quiz scores for 8 students in a class. First Quiz…
A: Given data is :
Q: The following is data for the first and second Quiz scores for 8 students in a class. First Quiz…
A: Points are plotted below
Q: Create a box and whisker plot for Dauphin Island. Gulf of Mexico Eastern Coast Water Temperatures…
A: The box plot contains 5-number summary. That is, the minimum value, the first quartile, the second…
Q: Do a stem-and-leaf plot for the same-sex parent’s height split by gender at birth. gender height 2…
A: Stem-and-leaf is a graphical method of displaying quantitative variable. The stem in the plot refers…
Q: Data was collected comparing the weight W (in pounds) of a yellowfin tuna to its length L (in…
A:
Q: The prices of the 19 top-rated all-season tires for a specific tire size, are as follows. Answer…
A:
Q: We are willing to regard the wood pieces prepared for the lab session as an SRS of all similar…
A: X (X-xbar)^2 33,190 5,517,801 32,320 2,187,441 23,040 60,855,601 24,050 46,117,681 31,860…
Q: Determine the number of triangles that can be drawn with the given data. a24, b 19, A 44
A:
Q: The prices of the 19 top-rated all-season tires for a specific tire size, are as follows. Answer…
A: We have to determine Q2 and Q1.
Q: Low=? High=?
A:
Q: Each student in a class has a box of Reese's pieces containing 25 candies. (The following is how…
A: Given: Sample size n = 25 Formula used: Sample proportion p = Xn
Q: The prices of 12 different types of cereal, rounded to the nearest dollar, are shown. Make a dot of…
A: Given:The prices of 12 different types of cereal, rounded to the nearest dollar. To make a dot of…
Q: Given that CM is a median of AABC, find x. x+4
A:
Q: The following data are the heights of 40 students: 59; 60; 61;68; 62; 70:62; 63; 63; 64;77 64; 64;…
A: Given data…
Q: An article gave the data, shown in the table below, on dimensions of 27 representative food…
A: The independent variables are Minimum Width, Maximum Width, and Elongation. The dependent variable…
Q: STATE: How heavy a load (in pounds) is needed to pull apart pieces of Douglas fir 44 inches long and…
A: The sample mean is, Thus, the sample mean is 118.7 pounds.
Q: The following table shows the median income, in thousands of dollars, of American families for 2003…
A: H = 52.587 x 1.035t For an exponential model: P = A x ( 1+r)t , r is called growth rate. Hence, for…
Q: If a class of qualitative data set is represented on a pie chart by an angle of 60 degrees, what is…
A: We have given that a class of qualitative data set is represented by a pie chart by an angle of 60…
Q: The prices of the 19 top-rated all-season tires for a specific tire size, are as follows. Answer…
A:
Q: A survey was conducted to determine student, faculty and administration attitudes on a new…
A: Given the data on the attitude on a new university parking facility for students , faculty and…
Q: The prices of the 19 top-rated all-season tires for a specific tire size, are as follows. Answer…
A: Use the Quartile position =n+1P100 . Then the Q2 will the number at the Quartile position. P will be…
Q: When an anthropologist finds skeletal remains, they need to figure out the height of the person. The…
A: Given: Sample size n = 22 Formula Used: Correlation coefficient r = n∑XY-∑X∑Yn∑X2-∑X2n∑Y2-∑Y2…
Q: We are willing to regard the wood pieces prepared for the lab session as an SRS of all similar…
A: Provided data is: 33,190 31,860 32,590 26,520 33,280 32,320 33,020 32,030…
Q: Which is the line-of-best-fit for the data represented below? Height Weight Tim 67 160 Evan 73…
A: Given the data We need to find the equation y=mx+b without using a calculator nor excel.
Q: accompanying data are lengths (inches) of bears. Find P15 35.5 37.5 39.5 39.5 41.5 42.5 44.0…
A: From the given data we want to find the 15 th percentile.
Q: (a) Construct a side-by-side stem-and-leaf plot for the two data sets. (b) Draw an overlay…
A:
Q: Use this data set to answer the following questions. (CSLO 1,2,7) 115 184 191 216 153 185 194 183…
A: Given data: 115, 191, 153, 194, 236, 184, 216, 185, 183, 202 Interquartile range is a measure of…

Step by step
Solved in 2 steps

- What are the lengths of the following dimensions in Figure 39-11? Alldimensions are in millimeters. a. Dimension A b. Dimension B c. Dimension CThe farmer in Exercise 33 has decided to take the fencing purchased and use it to enclose the subdivided plots shown. aWhat are the overall dimensions of the rectangular enclosure shown? bWhat is the total area of the enclosure shown?Use theorem 5.4.2 to form a proportion in which SV is a geometric mean. Hint: SVTRVS Exercises 1-6
- Mating parts are shown in Figure 29-16. The pins in the top piece fit into the holes in the bottom piece. All dimensions are in inches. Determine the following; a. The mean pin diameters b. The mean hole diameters c. The maximum dimension A d. The minimum dimension A e. The maximum dimension B f. The minimum dimension B g. The maximum total clearance between dimension C and dimension D h. The minimum total clearance between dimension C and dimension DIn the article “Evaluation of Low-Temperature Properties of HMA Mixtures”, the following values of fracture stress (in megapascals) were measured for a sample of 24 mixtures of hot-mixed asphalt (HMA).30 75 79 80 80 105 126 138 149 179 179 191223 232 232 236 240 242 245 247 254 274 384 470d) Construct a dot plot for the asphalt data.For this grouped data set: Scores | Frequencies 30-34 | 7 25-29 | 9 20-24 | 14 15-19 | 10 10-14 | 8 5-9 | 2 What is the Skewness and Kurtosis of the data set?
- STATE: How heavy a load (in pounds) is needed to pull apart pieces of Douglas fir 4 inches long and 1.5 inches square? Given are data from students doing a laboratory exercise. 33,190 31,860 32,590 26,520 33,280 32,320 33,020 32,030 30,460 32,700 23,040 30,930 32,720 33,650 32,340 24,050 30,170 31,300 28,730 31,920 We are willing to regard the wood pieces prepared for the lab session as an SRS of all similar pieces of Douglas fir. Engineers also commonly assume that characteristics of materials vary Normally. Suppose that the strength of pieces of wood like these follows a Normal distribution with standard deviation 3000 pounds. PLAN: We will estimate ? by giving a 98% confidence interval. SOLVE: Find the sample mean ?¯ . (Enter your answer rounded to the nearest whole number.) ?¯= Give a 98% confidence interval, [???,ℎ??ℎ] , for the mean load required to pull the wood apart. (Enter your answers rounded to the nearest whole number.) ???=…An agent for a property management company would like to be able to predict the monthly rental cost for apartments based on the size of the apartment as defined by square footage. A sample of the rent of 25 apartments in a college rental neighborhood was selected, and the information collected revealed the following: Apartment Size (Sq. Ft.) Monthly Rent ($) 1 850 950 2 1,450 1,600 3 1,085 1,200 4 1,232 1,500 5 718 950 6 1,485 1,700 7 1,136 1,650 8 726 935 9 700 875 10 956 1,150 11 1,100 1,400 12 1,285 1,650 13 1,985 2,300 14 1,369 1,800 15 1,175 1,400 16 1,225 1,450 17 1,245 1,100 18 1,259 1,700 19 1,150 1,200 20 896 1,150 21 1,361 1,600 22 1,040 1,650 23 755 1,200 24 1,000 800 25 1,200 1,750 e) Determine the coefficient of determination r2 and then completely interpret…An agent for a property management company would like to be able to predict the monthly rental cost for apartments based on the size of the apartment as defined by square footage. A sample of the rent of 25 apartments in a college rental neighborhood was selected, and the information collected revealed the following: Apartment Size (Sq. Ft.) Monthly Rent ($) 1 850 950 2 1,450 1,600 3 1,085 1,200 4 1,232 1,500 5 718 950 6 1,485 1,700 7 1,136 1,650 8 726 935 9 700 875 10 956 1,150 11 1,100 1,400 12 1,285 1,650 13 1,985 2,300 14 1,369 1,800 15 1,175 1,400 16 1,225 1,450 17 1,245 1,100 18 1,259 1,700 19 1,150 1,200 20 896 1,150 21 1,361 1,600 22 1,040 1,650 23 755 1,200 24 1,000 800 25 1,200 1,750 i) Determine a 95% interval estimate for the average rent of apartments with 1000…
- STATE: How heavy a load (in pounds) is needed to pull apart pieces of Douglas fir 44 inches long and 1.5 inches square? Given are data from students doing a laboratory exercise. 33,190 31,860 32,590 26,520 33,280 32,320 33,020 32,030 30,460 32,700 23,040 30,930 32,720 33,650 32,340 24,050 30,170 31,300 28,730 31,920 We are willing to regard the wood pieces prepared for the lab session as an SRS of all similar pieces of Douglas fir. Engineers also commonly assume that characteristics of materials vary Normally. Suppose that the strength of pieces of wood like these follows a Normal distribution with standard deviation 3000 pounds. PLAN: We will estimate μ by giving a 95% confidence interval. SOLVE: Find the sample mean x¯ . (Enter your answer rounded to the nearest whole number.) x¯= Give a 95% confidence interval, [low, high] , for the mean load required to pull the wood apart. (Enter your answers rounded to the nearest whole number.) low=…Refer to the accompanying data display that results from a sample of airport data speeds in Mbps. Complete parts (a) through (c) below. Tinterval (13.046,22.15) x=17.598 Sx=16.01712719 n=50The following data pertain to x, the amount of fertil-izer (in pounds) that a farmer applies to his soil, and y, his yield of wheat (in bushels per acre): xy xy xy112 33 88 24 37 2792 28 44 17 23 972 38 132 36 77 3266 17 23 14 142 38112 35 57 25 37 1388 31 111 40 127 2342 8 69 29 88 31126 37 19 12 48 3772 32 103 27 61 2552 20 141 40 71 1428 17 77 26 113 26 Assuming that the data can be looked upon as a randomsample from a bivariate normal population, calculate rand test its significance at the 0.01 level of significance.Also, draw a scattergram of these paired data and judgewhether the assumption seems reasonable.
