1. For each day of last year, the number of vehicles passing through a certain intersection was recorded by a city engineer. One objective of this study was to determine the percentage of days that more than 425 vehicles used the intersection. If the mean data was 375 vehicles per day and the standard deviation was 25 vehicles: (d) Suppose the relative frequency distribution for the data is bell-shaped, then what percentage of days more vehicles used the intersection ? 16% 5% 32% 2.5% than 425
1. For each day of last year, the number of vehicles passing through a certain intersection was recorded by a city engineer. One objective of this study was to determine the percentage of days that more than 425 vehicles used the intersection. If the mean data was 375 vehicles per day and the standard deviation was 25 vehicles: (d) Suppose the relative frequency distribution for the data is bell-shaped, then what percentage of days more vehicles used the intersection ? 16% 5% 32% 2.5% than 425

Glencoe Algebra 1, Student Edition, 9780079039897, 0079039898, 2018
18th Edition
ISBN:9780079039897
Author:Carter
Publisher:Carter
Chapter10: Statistics
Section10.4: Distributions Of Data
Problem 19PFA

Related questions
Question
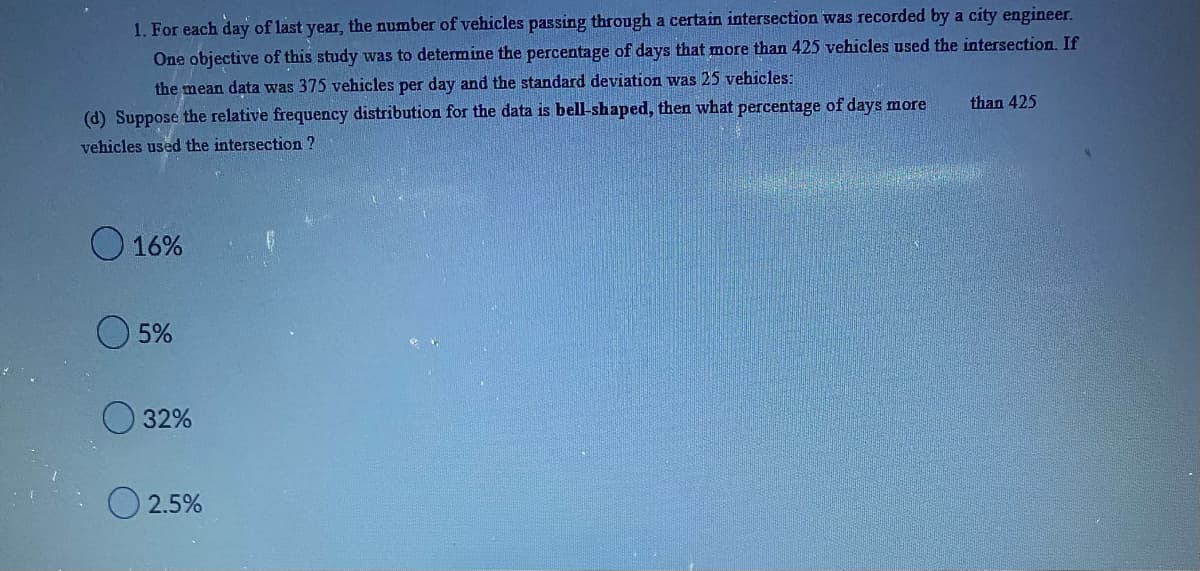
Transcribed Image Text:1. For each day of last year, the number of vehicles passing through a certain intersection was recorded by a city engineer.
One objective of this study was to determine the percentage of days that more than 425 vehicles used the intersection. If
the mean data was 375 vehicles per day and the standard deviation was 25 vehicles:
(d) Suppose the relative frequency distribution for the data is bell-shaped, then what percentage of days more
vehicles used the intersection ?
O 16%
5%
32%
2.5%
than 425
Expert Solution
This question has been solved!
Explore an expertly crafted, step-by-step solution for a thorough understanding of key concepts.

This is a popular solution!

Trending now
This is a popular solution!

Step by step
Solved in 2 steps

Follow-up Questions
Read through expert solutions to related follow-up questions below.
Follow-up Question

Transcribed Image Text:1. For each day of last year, the number of vehicles passing through a certain intersection was recorded by a city engineer.
One objective of this study was to determine the percentage of days that more than 425 vehicles used the intersection. If
the mean data was 375 vehicles per day and the standard deviation was 25 vehicles:
(d) Suppose the relative frequency distribution for the data is bell-shaped, then what percentage of days more
vehicles used the intersection ?
16%
5%
32%
2.5%.
than 425
Solution
Recommended textbooks for you
Glencoe Algebra 1, Student Edition, 9780079039897…
Algebra
ISBN:
9780079039897
Author:
Carter
Publisher:
McGraw Hill
Glencoe Algebra 1, Student Edition, 9780079039897…
Algebra
ISBN:
9780079039897
Author:
Carter
Publisher:
McGraw Hill