1. For this exercise, use the data in Table 1 Put the data in lists L1 and L2 Fathers' Heights (x): 68.8 65.3 66.2 66.1 71.5 67.0 71.3 68.3 62.9 70.1 Sons' Heights (y): 72.9 70.5 67.8 64.7 70.4 67.0 69.5 66.8 68.5 78.2 Table 1: Heights of ten fathers and their sons (in inches)
1. For this exercise, use the data in Table 1 Put the data in lists L1 and L2 Fathers' Heights (x): 68.8 65.3 66.2 66.1 71.5 67.0 71.3 68.3 62.9 70.1 Sons' Heights (y): 72.9 70.5 67.8 64.7 70.4 67.0 69.5 66.8 68.5 78.2 Table 1: Heights of ten fathers and their sons (in inches)

Functions and Change: A Modeling Approach to College Algebra (MindTap Course List)
6th Edition
ISBN:9781337111348
Author:Bruce Crauder, Benny Evans, Alan Noell
Publisher:Bruce Crauder, Benny Evans, Alan Noell
Chapter5: A Survey Of Other Common Functions
Section5.3: Modeling Data With Power Functions
Problem 6E: Urban Travel Times Population of cities and driving times are related, as shown in the accompanying...

Related questions
Topic Video
Question
Solve these questions using the data table below please
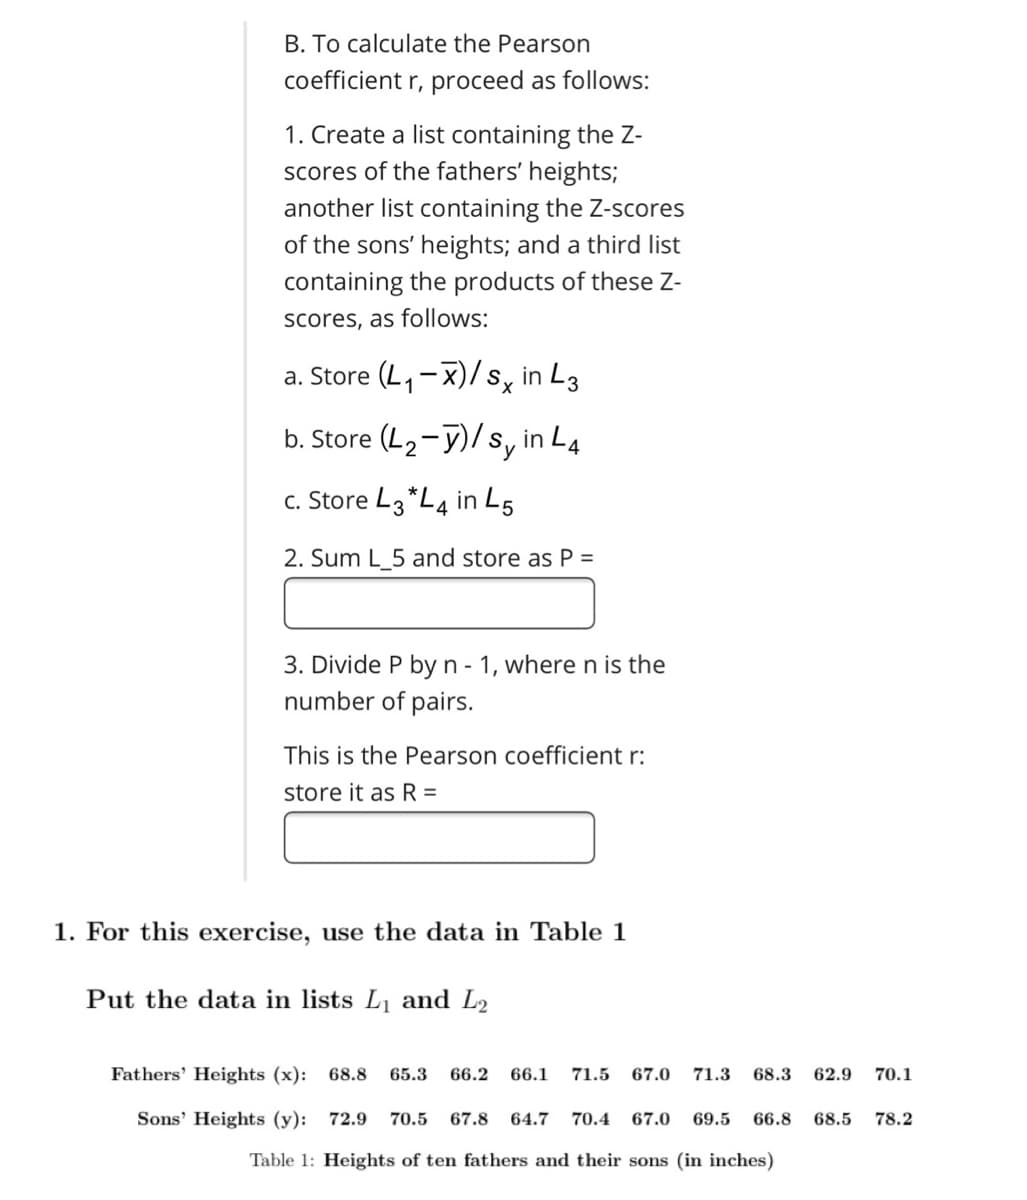
Transcribed Image Text:B. To calculate the Pearson
coefficient r, proceed as follows:
1. Create a list containing the Z-
scores of the fathers' heights;
another list containing the Z-scores
of the sons' heights; and a third list
containing the products of these Z-
Scores, as follows:
a. Store (L, -X)/ s, in L3
b. Store (L2-y)/s, in L4
c. Store L3 *L4 in L5
2. Sum L_5 and store as P =
3. Divide P byn - 1, where n is the
number of pairs.
This is the Pearson coefficient r:
store it as R =
1. For this exercise, use the data in Table 1
Put the data in lists L and L2
Fathers' Heights (x): 68.8
65.3
66.2
66.1
71.5
67.0
71.3
68.3
62.9
70.1
Sons' Heights (y): 72.9
70.5
67.8
64.7
70.4
67.0
69.5
66.8
68.5
78.2
Table 1: Heights of ten fathers and their sons (in inches)
Expert Solution
This question has been solved!
Explore an expertly crafted, step-by-step solution for a thorough understanding of key concepts.

Step by step
Solved in 2 steps

Knowledge Booster


Learn more about
Need a deep-dive on the concept behind this application? Look no further. Learn more about this topic, statistics and related others by exploring similar questions and additional content below.Recommended textbooks for you
Functions and Change: A Modeling Approach to Coll…
Algebra
ISBN:
9781337111348
Author:
Bruce Crauder, Benny Evans, Alan Noell
Publisher:
Cengage Learning
Functions and Change: A Modeling Approach to Coll…
Algebra
ISBN:
9781337111348
Author:
Bruce Crauder, Benny Evans, Alan Noell
Publisher:
Cengage Learning