The article "Lead Dissolution from Lead Smelter Slags Using Magnesium Chloride Solutions" (A. Xenidis, T. Lillis, and I. Hallikia, The AusIMM Proceedings, 1999:37-14) discusses an investigation of leaching rates of lead in solutions of magnesium chloride. The data in the following table (read from a graph) present the percentage of lead that has been extracted at various times (in minutes). Time (t) 4 8 16 30 60 120 Percent extracted (v) |1.2 1.6 2.3 2.8 3.6 4.4 a. The article suggests fitting a quadratic model y = Bo + B,t + Bz² + ɛ to these data. Fit this model, and compute the standard deviations of the coefficients. b. The reaction rate at time t is given by the derivative dy/dt = B, + 2B,t. Estimate the time at which the reaction rate will be equal to 0.05. c. The reaction rate at t = Oisequal to B1. Find a 95% confidence interval for the reaction rate at t = 0. d. Can you conclude that the reaction rate is decreasing with time? Explain.
The article "Lead Dissolution from Lead Smelter Slags Using Magnesium Chloride Solutions" (A. Xenidis, T. Lillis, and I. Hallikia, The AusIMM Proceedings, 1999:37-14) discusses an investigation of leaching rates of lead in solutions of magnesium chloride. The data in the following table (read from a graph) present the percentage of lead that has been extracted at various times (in minutes). Time (t) 4 8 16 30 60 120 Percent extracted (v) |1.2 1.6 2.3 2.8 3.6 4.4 a. The article suggests fitting a quadratic model y = Bo + B,t + Bz² + ɛ to these data. Fit this model, and compute the standard deviations of the coefficients. b. The reaction rate at time t is given by the derivative dy/dt = B, + 2B,t. Estimate the time at which the reaction rate will be equal to 0.05. c. The reaction rate at t = Oisequal to B1. Find a 95% confidence interval for the reaction rate at t = 0. d. Can you conclude that the reaction rate is decreasing with time? Explain.

Glencoe Algebra 1, Student Edition, 9780079039897, 0079039898, 2018
18th Edition
ISBN:9780079039897
Author:Carter
Publisher:Carter
Chapter10: Statistics
Section10.1: Measures Of Center
Problem 9PPS

Related questions
Question
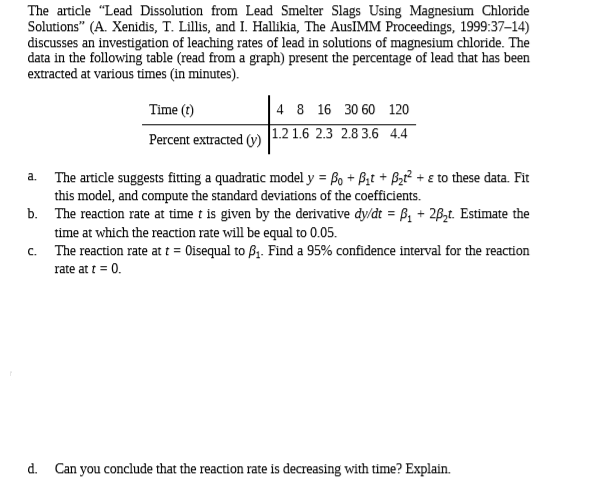
Transcribed Image Text:The article "Lead Dissolution from Lead Smelter Slags Using Magnesium Chloride
Solutions" (A. Xenidis, T. Lillis, and I. Hallikia, The AusIMM Proceedings, 1999:37-14)
discusses an investigation of leaching rates of lead in solutions of magnesium chloride. The
data in the following table (read from a graph) present the percentage of lead that has been
extracted at various times (in minutes).
Time (t)
4 8 16 30 60 120
Percent extracted (v) |1.2 1.6 2.3 2.8 3.6 4.4
a. The article suggests fitting a quadratic model y = Bo + B,t + Bz² + ɛ to these data. Fit
this model, and compute the standard deviations of the coefficients.
b. The reaction rate at time t is given by the derivative dy/dt = B, + 2B,t. Estimate the
time at which the reaction rate will be equal to 0.05.
c. The reaction rate at t = Oisequal to B1. Find a 95% confidence interval for the reaction
rate at t = 0.
d. Can you conclude that the reaction rate is decreasing with time? Explain.
Expert Solution
This question has been solved!
Explore an expertly crafted, step-by-step solution for a thorough understanding of key concepts.

Step by step
Solved in 3 steps with 5 images

Recommended textbooks for you
Glencoe Algebra 1, Student Edition, 9780079039897…
Algebra
ISBN:
9780079039897
Author:
Carter
Publisher:
McGraw Hill
Glencoe Algebra 1, Student Edition, 9780079039897…
Algebra
ISBN:
9780079039897
Author:
Carter
Publisher:
McGraw Hill