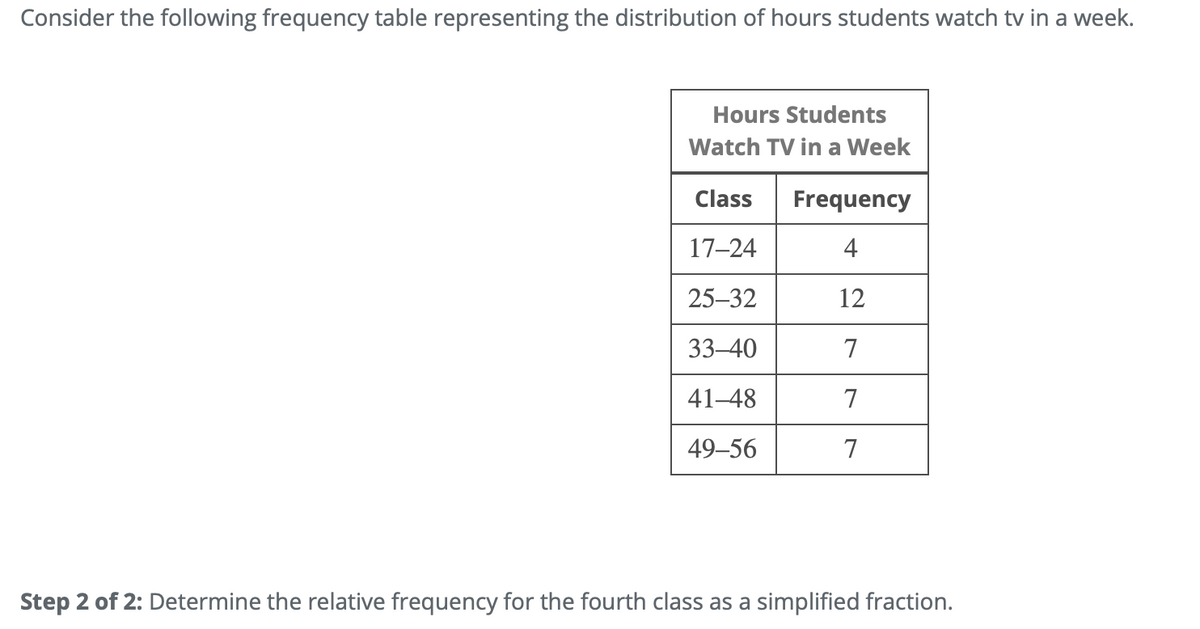
Consider the following frequency table representing the distribution of hours students watch tv in a week. Hours Students Watch TV in a Week Class Frequency 17–24 4 25–32 12 33-40 7 41–48 7 49–56 7
Consider the following frequency table representing the distribution of hours students watch tv in a week. Hours Students Watch TV in a Week Class Frequency 17–24 4 25–32 12 33-40 7 41–48 7 49–56 7

Glencoe Algebra 1, Student Edition, 9780079039897, 0079039898, 2018
18th Edition
ISBN:9780079039897
Author:Carter
Publisher:Carter
Chapter10: Statistics
Section10.6: Summarizing Categorical Data
Problem 10CYU

Related questions
Question
Transcribed Image Text:Consider the following frequency table representing the distribution of hours students watch tv in a week.
Hours Students
Watch TV in a Week
Class
Frequency
17-24
4
25–32
12
33-40
7
41-48
7
49–56
7
Step 2 of 2: Determine the relative frequency for the fourth class as a simplified fraction.
Expert Solution
This question has been solved!
Explore an expertly crafted, step-by-step solution for a thorough understanding of key concepts.

This is a popular solution!

Trending now
This is a popular solution!

Step by step
Solved in 2 steps

Knowledge Booster


Learn more about
Need a deep-dive on the concept behind this application? Look no further. Learn more about this topic, statistics and related others by exploring similar questions and additional content below.Recommended textbooks for you
Glencoe Algebra 1, Student Edition, 9780079039897…
Algebra
ISBN:
9780079039897
Author:
Carter
Publisher:
McGraw Hill

Elementary Geometry For College Students, 7e
Geometry
ISBN:
9781337614085
Author:
Alexander, Daniel C.; Koeberlein, Geralyn M.
Publisher:
Cengage,
Glencoe Algebra 1, Student Edition, 9780079039897…
Algebra
ISBN:
9780079039897
Author:
Carter
Publisher:
McGraw Hill
Elementary Geometry For College Students, 7e
Geometry
ISBN:
9781337614085
Author:
Alexander, Daniel C.; Koeberlein, Geralyn M.
Publisher:
Cengage,