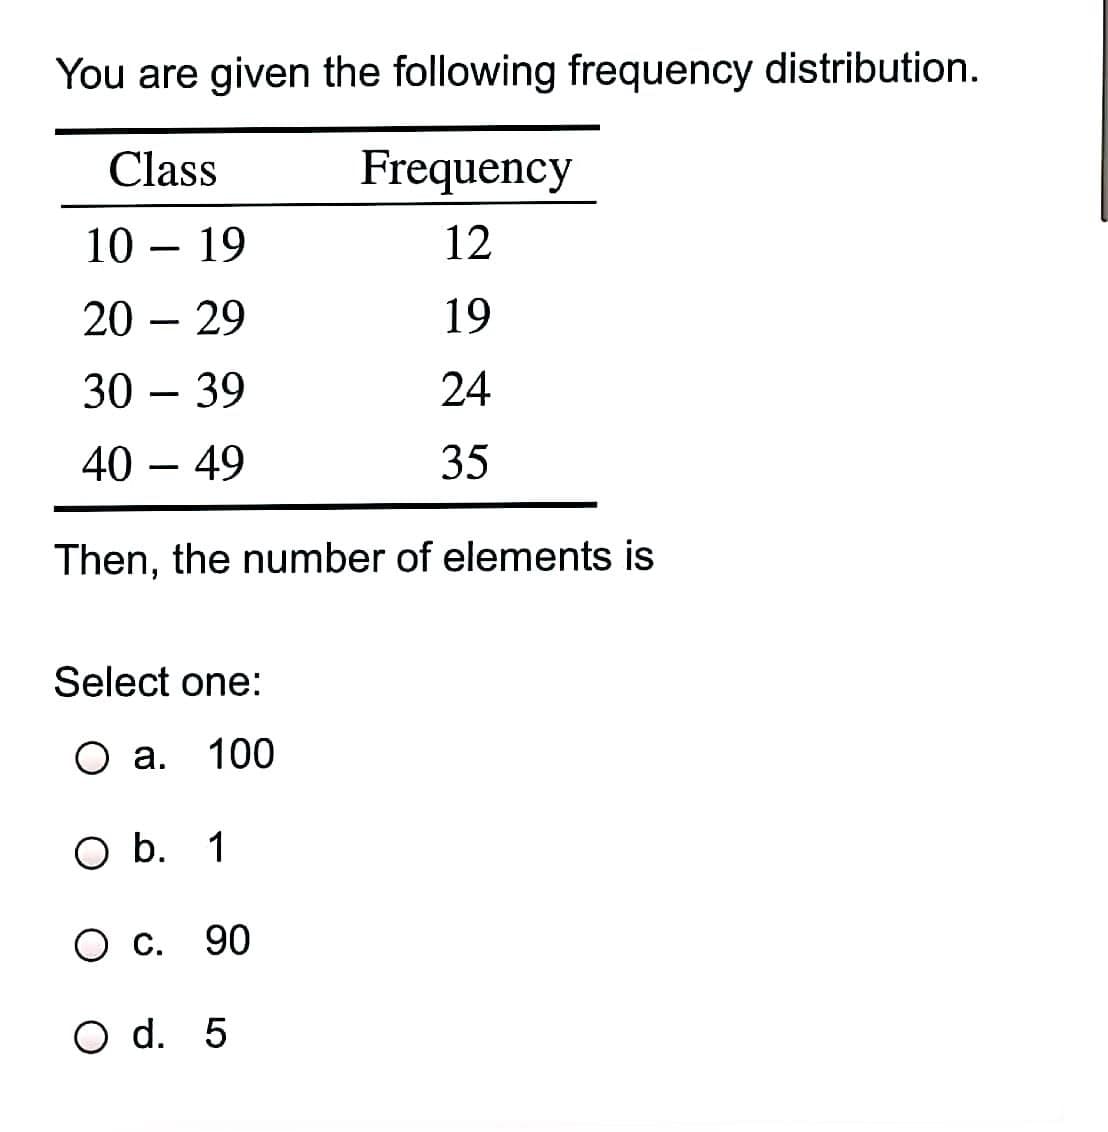
You are given the following frequency distribution. Class Frequency 10 – 19 12 20 – 29 19 30 – 39 24 40 – 49 35 Then, the number of elements is


Q: 4.6 4.6 4.4 4.5 4.3 4.7 49 4.6 4.6 4.6 4.5 4.7 4.5 4.5 4.6 4.6 4.6 4.8 1. Use the ungrouped data…
A: Hi! Thank you for the question, As per the honor code, we are allowed to answer three sub-parts at a…
Q: The section of statistics which involves the collection, organization, summarizing, and presentation…
A: Descriptive statistics: When the data is summarized by collecting, organizing and analyzing the data…
Q: A Quick-Change Oil company has a number of outlets. The numbers of oil changes at the 2nd street…
A: Note: According to Bartleby guidelines, expert solve only one question and maximum 3 subpart of the…
Q: Refer to the following distribution of ages. Ages 40 up to 50 se up to 60 Frequency 10 28 60 up to…
A: For the given data Find Relative frequency for lowest class = ?
Q: Which of the following is a subset of the population? a Distribution b. Sample c.Data d.Set
A: sample : A finite subset of a population is knownas sample . A sample refers to a smaller,…
Q: You are given the following frequency distribution, Class Frequency 10 – 19 12 20 – 29 19 - 30 – 39…
A: The given frequency distribution is, Class Frequency 10-19 12 20-29 19 30-39 24 40-49 35
Q: McDonald’s Dinner Service Times Refer to the accompanying frequency distribution. What problem would…
A: The given classes of the frequency distribution are 60-120, 120-180, 180-240, 240-300, 300-360.
Q: The data represent the ages of our Presidents at the time they were first inaugurated. 57 61 57 57…
A: The minimum and maximum ages are 42 and 69, respectively.
Q: 3. The average quantitative GRE scores for the top 30 graduate schools of engineering are listed…
A: Here Given data for GRE Score of Top 30 Graduate school of Engineering we will take class Width =10
Q: You are given the following frequency distribution. Class Frequency 10 – 19 12 - 20 – 29 19 30 – 39…
A: We have given that, The frequency distribution is, Class frequency 10-19…
Q: Find the missing frequency in the following distribution if N is 100 and Median is Marks : 0-10…
A:
Q: It seems these days that students have to work more and more each week to be able to afford the…
A: Class Frequency 26 - 30 8 31 - 35 25 36 - 40 20 41 - 45 12 46 - 50 8 51 - 55 3
Q: You are given the following frequency distribution. Age 0 – 12 Frequency 24 13 – 21 16 22 – 34 12 -…
A: Here we know that sample size is the number of observations or frequency.
Q: Find the missing frequency ʻP’, if the mean of the following frequency distribution is 21. 0 – 10 10…
A: Given: x 0 - 10 10 -20 20 - 30 30 - 40 40 - 50 f 3 2 2 2 P Mean X¯=…
Q: a1/ The data shown are the number of grams per serving of 30 selected brands of cakes. Construct a…
A: “Since you have asked multiple questions, we will solve the first question for you. If you want any…
Q: Below you are given the examination scores of 20 students. 52 99 92 86 84 63 72 76 95 88 92…
A:
Q: Twenty persons were given a blood test to determine their blood type. The data set is A А в В B АВ О…
A:
Q: How many classes a frequency distribution should have а. Neither very large nor very small number b.…
A: Introduction The given question on frequency distribution is a multiple choice question. So in the…
Q: Cicero Manufacturing Inc. produced the following number of products in the week between Christmas…
A: Given data: 27 27 27 28 27 25 25 28 26 28 26 28 31 30 26 26 To organize the data into a frequency…
Q: Roman, a health data officer, was tasked to create a report describing the height of all the…
A: Data 134.3 139.9 140.7 141.2 141.8 142.7 142.8 143.1 143.6…
Q: Oue. Students in a test were accarding to the frequency table given below: The marks obt Marks 23 24…
A: Given data are appropriate for measures of central tendency. Central tendency is used to find the…
Q: A math dasses at a North Toronto high school took a quiz. The grades for the 9 students in the class…
A: We have given that the data in table form. We can write this data in discrete form as: 3, 5, 5, 5,…
Q: Use the appropriate grouping method to : a. determine a frequency distribution. b. obtain a…
A: It is given data represents the number of siblings of introductory statistics students.
Q: Ages Number of students 15-18 19-22 23-26 8 27-30 31-34 35-38 Based on the frequency distribution…
A: Note: In the class interval of a--b, Here, a represents the lower class limit and the upper class…
Q: 17. Academy Award-Winning Male Actors. The following data show the ages of all Academy Award-winning…
A: Frequency Distribution: A frequency distribution is representations of data in a graphical or…
Q: 17. Academy Award-Winning Male Actors. The following data show the ages of all Academy Award-winning…
A:
Q: A. Analyze and interpret the following data set. 1. Twenty-five army inductees were given a blood…
A:
Q: You are given the following frequency distribution. Class Frequency 10 – 19 12 20 29 19 - 30 39 24 -…
A:
Q: 3. The blood types of 20 patients are listed below: B B AB A B AB B A Construct a categorical…
A: The data shows the blood types of 20 patients.
Q: Complete the given frequency distribution table to find the mean, median and mode. Write their…
A:
Q: 5. Here is the list of grades from a test from a math class: IS ААAАВССССВСВАВАDDBOСССААFFDABВВ Make…
A: 5. The frequency for each category is obtained by counting the number of responses corresponding to…
Q: 1- Ages of the Vice Presidents at the Time of Their Death The ages of the Vice Presidents of the…
A: As per guidelines, we will only solve first question, please repost other questions for more…
Q: Thirty-five soccer players were challenged to do as many sit-ups as possible in two minutes. Here…
A: We have to construct frequency distribution for mentioned data First we will arrange data. Than we…
Q: 78 64 66 84 51 67 48 80 62 66 56 52 82 53 73 90 82 78 57 77 77 66 85 56 46 88 75 60 59 71 a.…
A: Frequency Distribution : A frequency distribution is an overview of all distinct values in some…
Q: A researcher surveys a sample of n 20 college students and asks each person to identify their…
A:
Q: 3. Consider the result of a fictional Statistics final exam taken by 120 students, as given in the…
A:
Q: 2. Here are the scores on the first exam in an introductory statistics course for 30 students in one…
A:
Q: 6, The test scores of 40 students are summarized in the frequency distribution below. Find the mean.…
A: Given that,Test scores of 40 students are summarized in the frequency distribution table.
Q: Q. 3: When 30 randomly selected customers left a convenience store, each was asked the number of…
A: A frequency distribution is a systematic presentation of the values taken by a variable along with…
Q: Hospital admissions: The following frequency distribution presents the five most frequent reasons…
A: Given that ; From the frequency table. Make a frequency bar graph by using frequency table.
Q: Q2- The following table includes the grades of students who took Math during Fall. 40 55 50 55 28 60…
A: The data is 40,55,50,55,28,60,25,55,60,65,70,64,62,70,50,65,55,48,69,25,64,58,55,71
Q: 4. A sporting goods store kept a record of sales of five items for one randomly selected hour during…
A:
Q: 8. Find the Men, Mode and Median for A) the given frequency distribution table 6. 10 4. 3. 1
A:
Q: 3. The blood types of 25 blood donors are given below. Summarize the data using a frequency…
A: Hi! Thank you for the question, As per the honor code, we are allowed to answer one question at a…
Q: The frequency distribution below summarizes emplovee years of service for Alpha Corporation. The…
A: Given: Year of Service Frequency 11-15 2 16-20 15 21-25 10 26-30 5 31-35 3
Q: Find the mean from the frequency table below. Classes Frequency 10-14 8 15-19 29…
A: Class Frequency (f) Mid value (x) f⋅x 10-14 8 12 96 15-19 29 17 493 20-24 42 22 924 25-29 7…
Q: 6. Below is a frequency distribution. Classes 0-14 4. 15-29 18 30-44 12
A: (a) - Mean deviation : Mean ˉx∑fx/∑f =1649/47 =35.0851 Class(1) f(2) Mid value…
Q: A sample of 200 college freshmen was asked how many hours per week they spent playing video games.…
A: The question is about frequency distribution Given :
Q: The following data represents the age of 30 lottery winners. 23 29 32 33 34 35 37 38 40 40 40 41…
A: The minimum and maximum value of the data are 23 and 86, respectively.
Q: 0.287 0.255 0.324 0.327 0.301 0.341…
A:

Step by step
Solved in 2 steps
