1. How many odd four-digit numbers can be formed from 0,1,2,3,4,5,6,7,8,9 if each digit can be used only once.
1. How many odd four-digit numbers can be formed from 0,1,2,3,4,5,6,7,8,9 if each digit can be used only once.

Holt Mcdougal Larson Pre-algebra: Student Edition 2012
1st Edition
ISBN:9780547587776
Author:HOLT MCDOUGAL
Publisher:HOLT MCDOUGAL
ChapterCSR: Contents Of Student Resources
Section: Chapter Questions
Problem 15.2P

Related questions
Question
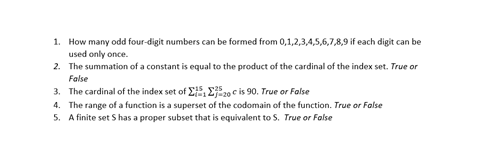
Transcribed Image Text:1. How many odd four-digit numbers can be formed from 0,1,2,3,4,5,6,7,8,9 if each digit can be
used only once.
2. The summation of a constant is equal to the product of the cardinal of the index set. True or
False
3. The cardinal of the index set of E,Ej20 c is 90. True or False
4. The range of a function is a superset of the codomain of the function. True or False
5. A finite set S has a proper subset that is equivalent to S. True or False
Expert Solution
This question has been solved!
Explore an expertly crafted, step-by-step solution for a thorough understanding of key concepts.

Step by step
Solved in 3 steps

Recommended textbooks for you
Holt Mcdougal Larson Pre-algebra: Student Edition…
Algebra
ISBN:
9780547587776
Author:
HOLT MCDOUGAL
Publisher:
HOLT MCDOUGAL
Holt Mcdougal Larson Pre-algebra: Student Edition…
Algebra
ISBN:
9780547587776
Author:
HOLT MCDOUGAL
Publisher:
HOLT MCDOUGAL