1. Measure the degree of relationship of the following sets of variables using the appropriate formula for correlation and interpret the result: Five Finalist A B C D E As Ranked by Male Judge 4 2 1 5 3 As Ranked by Female Judge 2.5 1 2.5 4 5
1. Measure the degree of relationship of the following sets of variables using the appropriate formula for correlation and interpret the result: Five Finalist A B C D E As Ranked by Male Judge 4 2 1 5 3 As Ranked by Female Judge 2.5 1 2.5 4 5

Glencoe Algebra 1, Student Edition, 9780079039897, 0079039898, 2018
18th Edition
ISBN:9780079039897
Author:Carter
Publisher:Carter
Chapter10: Statistics
Section10.6: Summarizing Categorical Data
Problem 23PPS

Related questions
Question
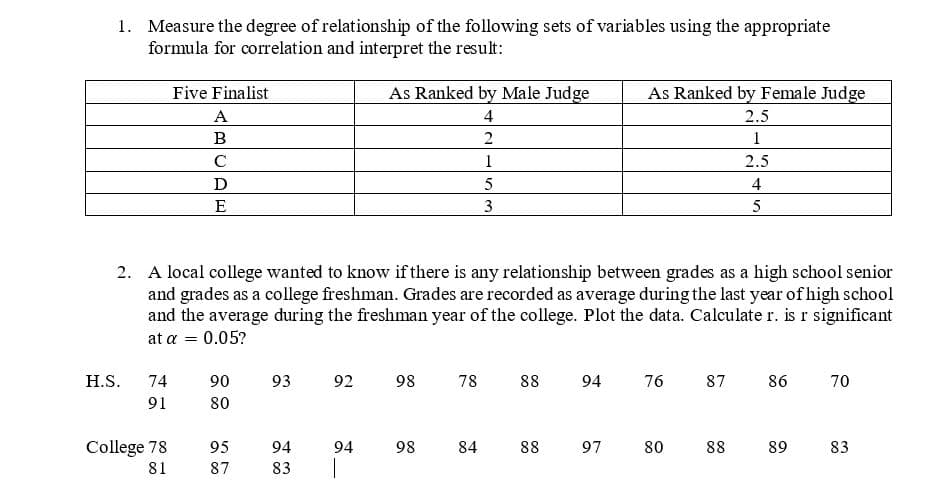
Transcribed Image Text:1. Measure the degree of relationship of the following sets of variables using the appropriate
formula for correlation and interpret the result:
H.S.
74
91
Five Finalist
A
B
C
D
E
College 78
81
2. A local college wanted to know if there is any relationship between grades as a high school senior
and grades as a college freshman. Grades are recorded as average during the last year of high school
and the average during the freshman year of the college. Plot the data. Calculate r. is r significant
at a = 0.05?
90
80
95
87
93
92
94
83 T
As Ranked by Male Judge
4
2
94
98
98
78
1
5
3
84
88
As Ranked by Female Judge
2.5
1
2.5
94
76
88 97 80
87
4
5
88
86
70
89 83
Expert Solution
This question has been solved!
Explore an expertly crafted, step-by-step solution for a thorough understanding of key concepts.

Step by step
Solved in 2 steps

Recommended textbooks for you
Glencoe Algebra 1, Student Edition, 9780079039897…
Algebra
ISBN:
9780079039897
Author:
Carter
Publisher:
McGraw Hill
Glencoe Algebra 1, Student Edition, 9780079039897…
Algebra
ISBN:
9780079039897
Author:
Carter
Publisher:
McGraw Hill