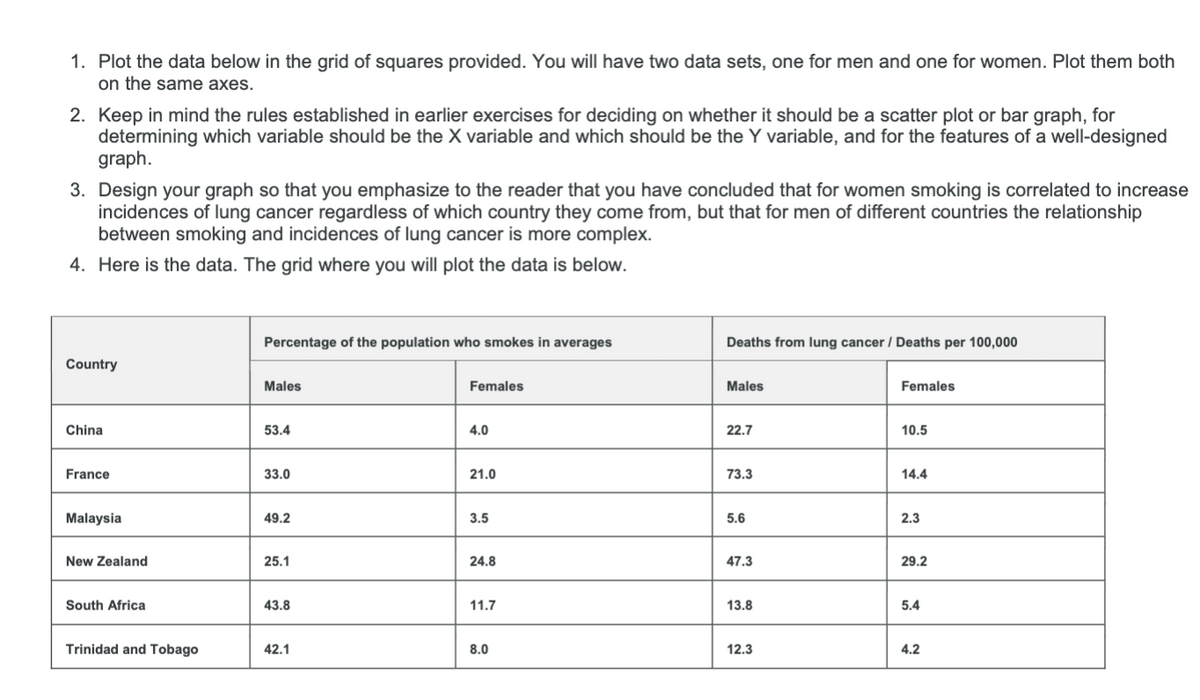
1. Plot the data below in the grid of squares provided. You will have two data sets, one for men and one for women. Plot them both on the same axes. 2. Keep in mind the rules established in earlier exercises for deciding on whether it should be a scatter plot or bar graph, for determining which variable should be the X variable and which should be the Y variable, and for the features of a well-designed graph. 3. Design your graph so that you emphasize to the reader that you have concluded that for women smoking is correlated to increase incidences of lung cancer regardless of which country they come from, but that for men of different countries the relationship between smoking and incidences of lung cancer is more complex. 4. Here is the data. The grid where you will plot the data is below. Percentage of the population who smokes in averages Deaths from lung cancer / Deaths per 100,000 Country Males Females Males Females China 53.4 4.0 22.7 10.5 France 33.0 21.0 73.3 14.4 Malaysia 49.2 3.5 5.6 2.3 New Zealand 25.1 24.8 47.3 29.2 South Africa 43.8 11.7 13.8 5.4 Trinidad and Tobago 42.1 8.0 12.3 4.2
1. Plot the data below in the grid of squares provided. You will have two data sets, one for men and one for women. Plot them both on the same axes. 2. Keep in mind the rules established in earlier exercises for deciding on whether it should be a scatter plot or bar graph, for determining which variable should be the X variable and which should be the Y variable, and for the features of a well-designed graph. 3. Design your graph so that you emphasize to the reader that you have concluded that for women smoking is correlated to increase incidences of lung cancer regardless of which country they come from, but that for men of different countries the relationship between smoking and incidences of lung cancer is more complex. 4. Here is the data. The grid where you will plot the data is below. Percentage of the population who smokes in averages Deaths from lung cancer / Deaths per 100,000 Country Males Females Males Females China 53.4 4.0 22.7 10.5 France 33.0 21.0 73.3 14.4 Malaysia 49.2 3.5 5.6 2.3 New Zealand 25.1 24.8 47.3 29.2 South Africa 43.8 11.7 13.8 5.4 Trinidad and Tobago 42.1 8.0 12.3 4.2

Elementary Geometry For College Students, 7e
7th Edition
ISBN:9781337614085
Author:Alexander, Daniel C.; Koeberlein, Geralyn M.
Publisher:Alexander, Daniel C.; Koeberlein, Geralyn M.
ChapterP: Preliminary Concepts
SectionP.1: Sets And Geometry
Problem 5E: Which type of path straight, curved, circular, or scattered is determined by: a a roller coaster? b...

Related questions

Topic Video
Question
Can you help me graph this information please?
Transcribed Image Text:1. Plot the data below in the grid of squares provided. You will have two data sets, one for men and one for women. Plot them both
on the same axes.
2. Keep in mind the rules established in earlier exercises for deciding on whether it should be a scatter plot or bar graph, for
determining which variable should be the X variable and which should be the Y variable, and for the features of a well-designed
graph.
3. Design your graph so that you emphasize to the reader that you have concluded that for women smoking is correlated to increase
incidences of lung cancer regardless of which country they come from, but that for men of different countries the relationship
between smoking and incidences of lung cancer is more complex.
4. Here is the data. The grid where you will plot the data is below.
Percentage of the population who smokes in averages
Deaths from lung cancer / Deaths per 100,000
Country
Males
Females
Males
Females
China
53.4
4.0
22.7
10.5
France
33.0
21.0
73.3
14.4
Malaysia
49.2
3.5
5.6
2.3
New Zealand
25.1
24.8
47.3
29.2
South Africa
43.8
11.7
13.8
5.4
Trinidad and Tobago
42.1
8.0
12.3
4.2

Expert Solution
This question has been solved!
Explore an expertly crafted, step-by-step solution for a thorough understanding of key concepts.

This is a popular solution!

Trending now
This is a popular solution!

Step by step
Solved in 2 steps

Knowledge Booster


Learn more about
Need a deep-dive on the concept behind this application? Look no further. Learn more about this topic, statistics and related others by exploring similar questions and additional content below.Recommended textbooks for you
Elementary Geometry For College Students, 7e
Geometry
ISBN:
9781337614085
Author:
Alexander, Daniel C.; Koeberlein, Geralyn M.
Publisher:
Cengage,

Glencoe Algebra 1, Student Edition, 9780079039897…
Algebra
ISBN:
9780079039897
Author:
Carter
Publisher:
McGraw Hill

Algebra & Trigonometry with Analytic Geometry
Algebra
ISBN:
9781133382119
Author:
Swokowski
Publisher:
Cengage
Elementary Geometry For College Students, 7e
Geometry
ISBN:
9781337614085
Author:
Alexander, Daniel C.; Koeberlein, Geralyn M.
Publisher:
Cengage,
Glencoe Algebra 1, Student Edition, 9780079039897…
Algebra
ISBN:
9780079039897
Author:
Carter
Publisher:
McGraw Hill
Algebra & Trigonometry with Analytic Geometry
Algebra
ISBN:
9781133382119
Author:
Swokowski
Publisher:
Cengage