1. Researchers studying anthropometry collected body girth measurements and skeletal diameter measurements, as well as age, weight, height and gender, for 507 physically active individuals. The histogram below shows the sample distribution of heights in centimeters, and the table shows sample statistics calculated based on this sample. Which of the following is not necessarily true? 100 80 60- 40 20- 0 150 160 170 Height 180 190 The sample median is 170.3 cm. O The population mean is 171.1 cm. The point estimate for the population mean is 171.1 cm. The sample mean is 171.1 cm. 200 Min Q1 Median Mean SD Q3 Max 147.2 163.8 170.3 171.1 9.4 177.8 198.1
1. Researchers studying anthropometry collected body girth measurements and skeletal diameter measurements, as well as age, weight, height and gender, for 507 physically active individuals. The histogram below shows the sample distribution of heights in centimeters, and the table shows sample statistics calculated based on this sample. Which of the following is not necessarily true? 100 80 60- 40 20- 0 150 160 170 Height 180 190 The sample median is 170.3 cm. O The population mean is 171.1 cm. The point estimate for the population mean is 171.1 cm. The sample mean is 171.1 cm. 200 Min Q1 Median Mean SD Q3 Max 147.2 163.8 170.3 171.1 9.4 177.8 198.1

Glencoe Algebra 1, Student Edition, 9780079039897, 0079039898, 2018
18th Edition
ISBN:9780079039897
Author:Carter
Publisher:Carter
Chapter10: Statistics
Section10.4: Distributions Of Data
Problem 19PFA

Related questions
Question
show complete solution
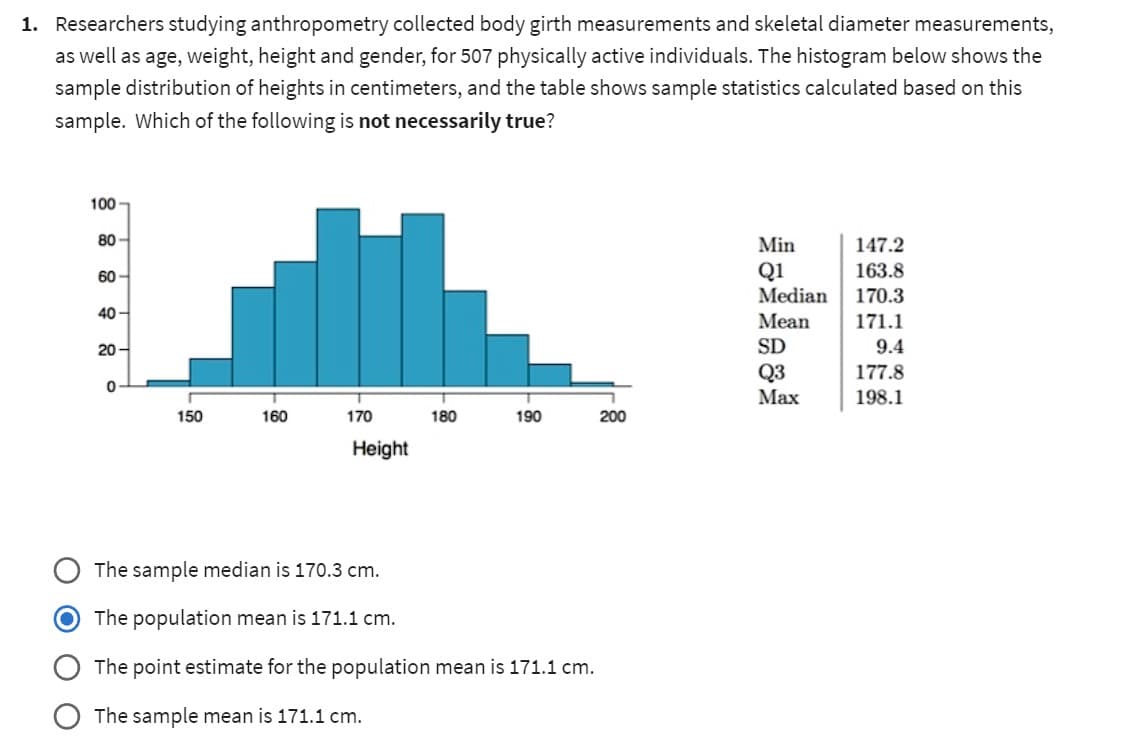
Transcribed Image Text:1. Researchers studying anthropometry collected body girth measurements and skeletal diameter measurements,
as well as age, weight, height and gender, for 507 physically active individuals. The histogram below shows the
sample distribution of heights in centimeters, and the table shows sample statistics calculated based on this
sample. Which of the following is not necessarily true?
100
80-
60
40
20
0
150
160
170
Height
180
190
The sample median is 170.3 cm.
The population mean is 171.1 cm.
The point estimate for the population mean is 171.1 cm.
The sample mean is 171.1 cm.
200
Min
Q1
Median
Mean
SD
Q3
Max
147.2
163.8
170.3
171.1
9.4
177.8
198.1
Expert Solution
This question has been solved!
Explore an expertly crafted, step-by-step solution for a thorough understanding of key concepts.

This is a popular solution!

Trending now
This is a popular solution!

Step by step
Solved in 2 steps

Recommended textbooks for you
Glencoe Algebra 1, Student Edition, 9780079039897…
Algebra
ISBN:
9780079039897
Author:
Carter
Publisher:
McGraw Hill
Glencoe Algebra 1, Student Edition, 9780079039897…
Algebra
ISBN:
9780079039897
Author:
Carter
Publisher:
McGraw Hill