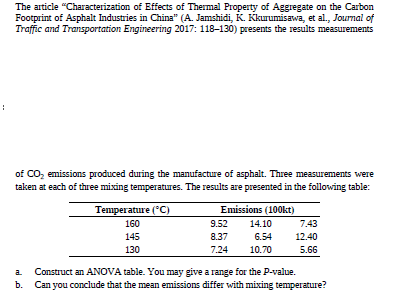
The article "Characterization of Effects of Thermal Property of Aggregate on the Carbon Footprint of Asphalt Industries in China" (A. Jamshidi, K. Kkurumisawa, et al., Journal of Traffic and Transportation Engineering 2017: 118-130) presents the results measurements of CO, emissions produced during the manufacture of asphalt. Three measurements were taken at each of three mixing temperatures. The results are presented in the following table: Temperature (*C) Emissions (100kt) 160 9.52 14.10 7.43 145 8.37 6.54 12.40 130 7.24 10.70 5.66 Construct an ANOVA table. You may give a range for the P-value. Can you conclude that the mean emissions differ with mixing temperature? a.
The article "Characterization of Effects of Thermal Property of Aggregate on the Carbon Footprint of Asphalt Industries in China" (A. Jamshidi, K. Kkurumisawa, et al., Journal of Traffic and Transportation Engineering 2017: 118-130) presents the results measurements of CO, emissions produced during the manufacture of asphalt. Three measurements were taken at each of three mixing temperatures. The results are presented in the following table: Temperature (*C) Emissions (100kt) 160 9.52 14.10 7.43 145 8.37 6.54 12.40 130 7.24 10.70 5.66 Construct an ANOVA table. You may give a range for the P-value. Can you conclude that the mean emissions differ with mixing temperature? a.

MATLAB: An Introduction with Applications
6th Edition
ISBN:9781119256830
Author:Amos Gilat
Publisher:Amos Gilat
Chapter1: Starting With Matlab
Section: Chapter Questions
Problem 1P

Related questions
Question
Transcribed Image Text:The article "Characterization of Effects of Thermal Property of Aggregate on the Carbon
Footprint of Asphalt Industries in China" (A. Jamshidi, K. Kkurumisawa, et al., Journal of
Traffic and Transportation Engineering 2017: 118-130) presents the results measurements
of CO, emissions produced during the manufacture of asphalt. Three measurements were
taken at each of three mixing temperatures. The results are presented in the following table:
Temperature (*C)
Emissions (100kt)
160
9.52
14.10
7.43
145
8.37
6.54
12.40
130
7.24
10.70
5.66
Construct an ANOVA table. You may give a range for the P-value.
Can you conclude that the mean emissions differ with mixing temperature?
a.
Expert Solution
This question has been solved!
Explore an expertly crafted, step-by-step solution for a thorough understanding of key concepts.

This is a popular solution!

Trending now
This is a popular solution!

Step by step
Solved in 2 steps with 2 images

Recommended textbooks for you
MATLAB: An Introduction with Applications
Statistics
ISBN:
9781119256830
Author:
Amos Gilat
Publisher:
John Wiley & Sons Inc

Probability and Statistics for Engineering and th…
Statistics
ISBN:
9781305251809
Author:
Jay L. Devore
Publisher:
Cengage Learning

Statistics for The Behavioral Sciences (MindTap C…
Statistics
ISBN:
9781305504912
Author:
Frederick J Gravetter, Larry B. Wallnau
Publisher:
Cengage Learning
MATLAB: An Introduction with Applications
Statistics
ISBN:
9781119256830
Author:
Amos Gilat
Publisher:
John Wiley & Sons Inc
Probability and Statistics for Engineering and th…
Statistics
ISBN:
9781305251809
Author:
Jay L. Devore
Publisher:
Cengage Learning
Statistics for The Behavioral Sciences (MindTap C…
Statistics
ISBN:
9781305504912
Author:
Frederick J Gravetter, Larry B. Wallnau
Publisher:
Cengage Learning

Elementary Statistics: Picturing the World (7th E…
Statistics
ISBN:
9780134683416
Author:
Ron Larson, Betsy Farber
Publisher:
PEARSON

The Basic Practice of Statistics
Statistics
ISBN:
9781319042578
Author:
David S. Moore, William I. Notz, Michael A. Fligner
Publisher:
W. H. Freeman

Introduction to the Practice of Statistics
Statistics
ISBN:
9781319013387
Author:
David S. Moore, George P. McCabe, Bruce A. Craig
Publisher:
W. H. Freeman