1. Two teachers teach two groups of students who are studying the same subject. In the first group, 30 students were selected of which 11 failed the quarterly examination while in the second group, 10 out of 24 students failed. At x = 0.01, is it valid to conclude that the rate of failure in the first group is less than that of the second group? What is the implication of the results of this test?
1. Two teachers teach two groups of students who are studying the same subject. In the first group, 30 students were selected of which 11 failed the quarterly examination while in the second group, 10 out of 24 students failed. At x = 0.01, is it valid to conclude that the rate of failure in the first group is less than that of the second group? What is the implication of the results of this test?

MATLAB: An Introduction with Applications
6th Edition
ISBN:9781119256830
Author:Amos Gilat
Publisher:Amos Gilat
Chapter1: Starting With Matlab
Section: Chapter Questions
Problem 1P

Related questions

Topic Video
Question
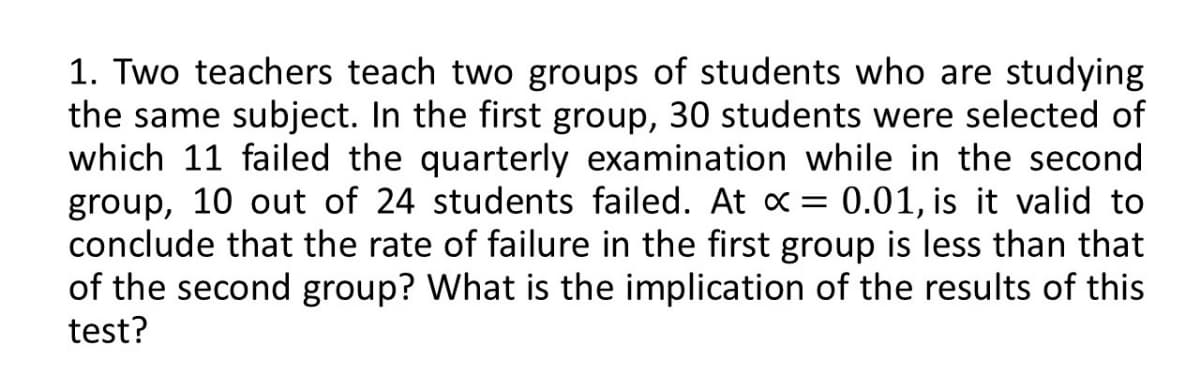
Transcribed Image Text:1. Two teachers teach two groups of students who are studying
the same subject. In the first group, 30 students were selected of
which 11 failed the quarterly examination while in the second
group, 10 out of 24 students failed. At x = 0.01, is it valid to
conclude that the rate of failure in the first group is less than that
of the second group? What is the implication of the results of this
test?
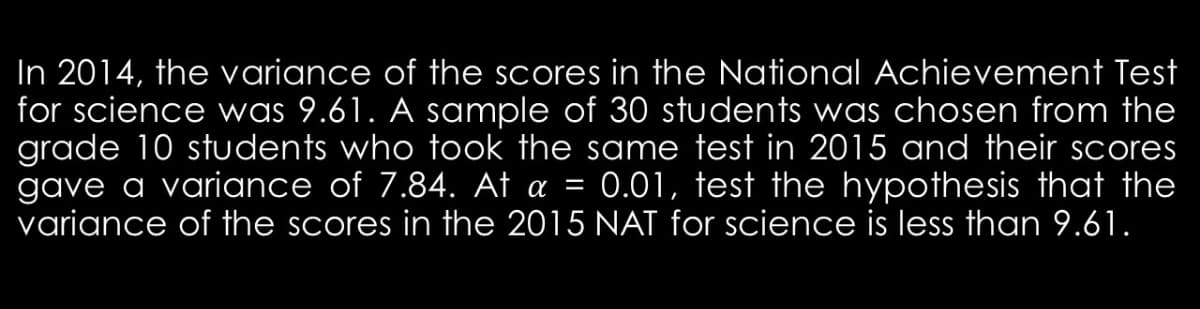
Transcribed Image Text:In 2014, the variance of the scores in the National Achievement Test
for science was 9.61. A sample of 30 students was chosen from the
grade 10 students who took the same test in 2015 and their scores
gave a variance of 7.84. At a = 0.01, test the hypothesis that the
variance of the scores in the 2015 NAT for science is less than 9.61.
Expert Solution
This question has been solved!
Explore an expertly crafted, step-by-step solution for a thorough understanding of key concepts.

Step by step
Solved in 2 steps

Knowledge Booster


Learn more about
Need a deep-dive on the concept behind this application? Look no further. Learn more about this topic, statistics and related others by exploring similar questions and additional content below.Recommended textbooks for you
MATLAB: An Introduction with Applications
Statistics
ISBN:
9781119256830
Author:
Amos Gilat
Publisher:
John Wiley & Sons Inc

Probability and Statistics for Engineering and th…
Statistics
ISBN:
9781305251809
Author:
Jay L. Devore
Publisher:
Cengage Learning

Statistics for The Behavioral Sciences (MindTap C…
Statistics
ISBN:
9781305504912
Author:
Frederick J Gravetter, Larry B. Wallnau
Publisher:
Cengage Learning
MATLAB: An Introduction with Applications
Statistics
ISBN:
9781119256830
Author:
Amos Gilat
Publisher:
John Wiley & Sons Inc
Probability and Statistics for Engineering and th…
Statistics
ISBN:
9781305251809
Author:
Jay L. Devore
Publisher:
Cengage Learning
Statistics for The Behavioral Sciences (MindTap C…
Statistics
ISBN:
9781305504912
Author:
Frederick J Gravetter, Larry B. Wallnau
Publisher:
Cengage Learning

Elementary Statistics: Picturing the World (7th E…
Statistics
ISBN:
9780134683416
Author:
Ron Larson, Betsy Farber
Publisher:
PEARSON

The Basic Practice of Statistics
Statistics
ISBN:
9781319042578
Author:
David S. Moore, William I. Notz, Michael A. Fligner
Publisher:
W. H. Freeman

Introduction to the Practice of Statistics
Statistics
ISBN:
9781319013387
Author:
David S. Moore, George P. McCabe, Bruce A. Craig
Publisher:
W. H. Freeman