
Intermediate Algebra
19th Edition
ISBN: 9780998625720
Author: Lynn Marecek
Publisher: OpenStax College
expand_more
expand_more
format_list_bulleted
Related questions
Question
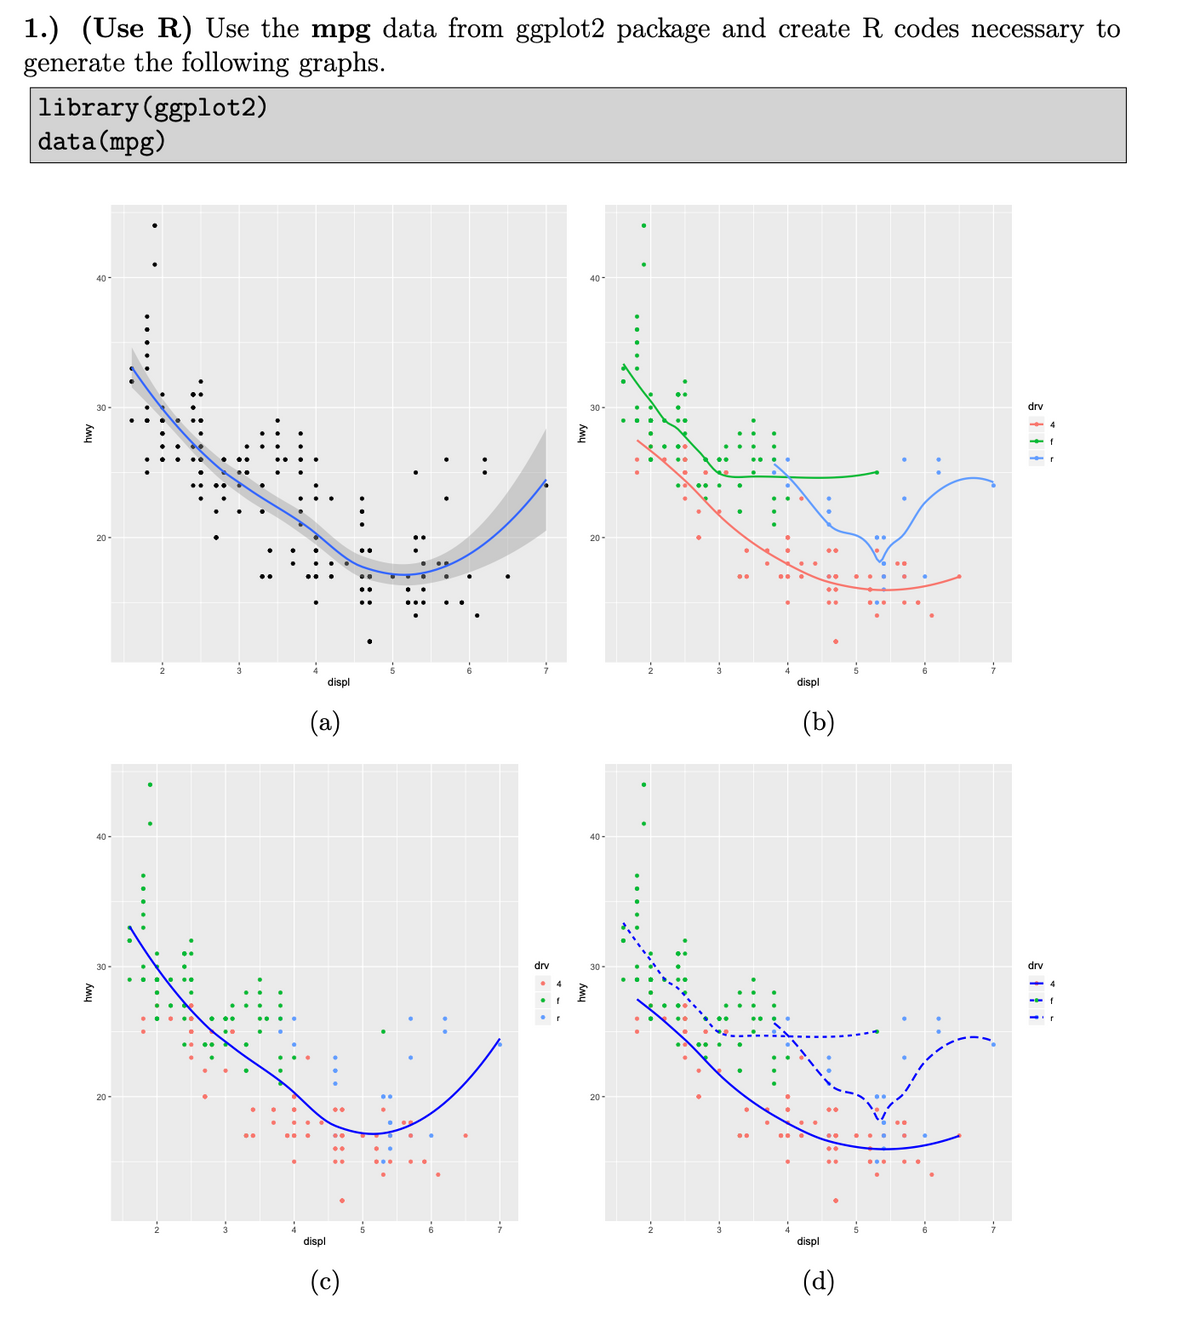

Transcribed Image Text:1.) (Use R) Use the mpg data from ggplot2 package and create R codes necessary to
generate the following graphs.
library(ggplot2)
data (mpg)
40-
20-
40-
30-
20-
displ
(a)
drv
40-
20-
40-
displ
€
(b)
drv
4
30-
dry
20-
displ
(c)
2
displ
(d)
--
Expert Solution
This question has been solved!
Explore an expertly crafted, step-by-step solution for a thorough understanding of key concepts.

Step by stepSolved in 2 steps with 3 images

Knowledge Booster

Similar questions
- Grapharrow_forwardThe following scatterplot shows the relationship between a house's area (in square feet) and its acreage, or the area of its lot. Explain the trend in context of the graph. Scatterplot of Acreage vs Area 3 500 1000 1500 2000 2500 3000 3500 Area (in square feet) For the toolbar, press ALT+F10 (PC) or ALT+FN+F10 (Mac). BIU S Paragraph Arial 10pt Ix Q ... x? X2 Ω Θ ABC - 田田 EX: Ť {i} P O WORDS POWERED BY TINY > > !!! +] 2. Acreagearrow_forwardA regulation NFL playing field of length x and width y has a perimeter of 346ź or "3" yards. 1040 (a) Draw a rectangle that gives a visual representation of the problem. Use the specified variables to label the sides of the rectangle. (b) Show that the width of the rectangle is y = – x and its area is A = x( - x). 520 (520 (c) Use a graphing utility to graph the area equation. Be sure to adjust your window settings. (d) From the graph in part (c), estimate the dimensions of the rectangle that yield a maximum area. (e) Use your school's library, the Internet, or some other reference source to find the actual dimensions and area of a regulation NFL playing field and compare your findings with the results of part (d).arrow_forward
- Pls help ASAParrow_forwardWhat program did you use to type in your code to create the graph?arrow_forwardDerive the linear interpolant through the two data points (1.0, 2.0) and (1.1, 2.5).Then, derive the quadratic interpolant through these two points and the point (1.2, 1.5). Show a graphdepicting this situation.arrow_forward
- provide three examples of the rectangular coordinate system, which is the basis for most consumer graphsarrow_forwardChess is a board game, where the board is made up of 64 squares arranged in an 8-by-8 grid. One of the pieces is a rook, which can move from its current square any number of spaces either vertically or horizontally (but not diagonally) in a single turn. Discuss how you could use graphs to show that a rook can get from its current square to any other square on the board in at most two turns. You’re encouraged to utilize relevant graph definitions, problems, and algorithms where appropriate.arrow_forwardExplain the grapharrow_forward
arrow_back_ios
arrow_forward_ios
Recommended textbooks for you