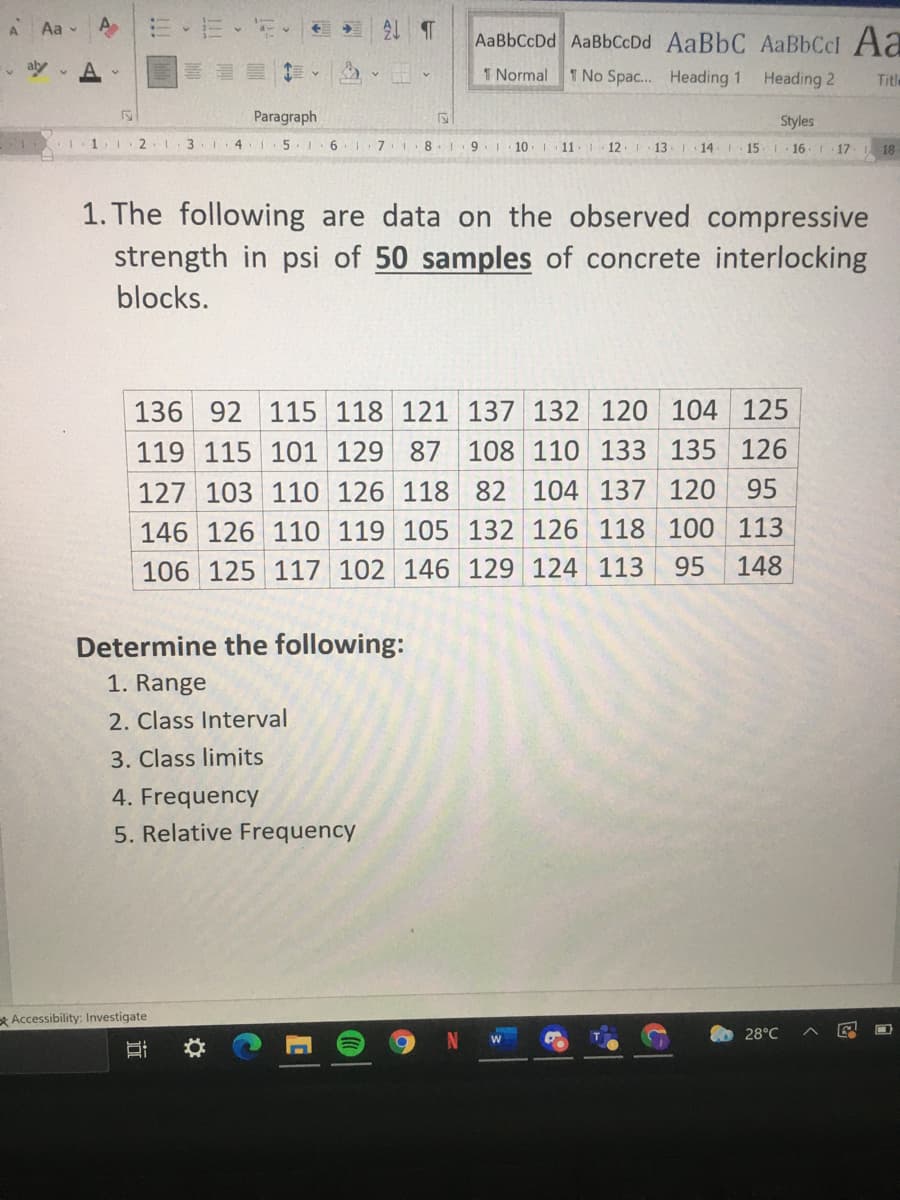
1. The following are data on the observed compressive strength in psi of 50 samples of concrete interlocking blocks. 136 92 115 118 121 137 132 120 104 125 119 115 101 129 87 108 110 133 135 126 127 103 110 126 118 82 104 137 120 95 146 126 110 119 105 132 126 118 100 113 106 125 117 102 146 129 124 113 95 148 Determine the following: 1. Range 2. Class Interval 3. Class limits 4. Frequency 5. Relative Frequency
Q: Table Q1(b): Results of compressive strength of concrete (in Psi) 2590 2530 2510 2566 2541 2589 2557…
A: A 95% confidence interval for true mean when the sample size is small is given by x¯±t*·sn, where s…
Q: The determination of the shear strength of spot welds is relatively difficult, whereas measuring he…
A: Given: Shear strength (psi) Weld diameter (0.0001 in) 370 400 780 800 1210 1250 1560 1600…
Q: An articde in the ACI Materials Journal (val. 84, 1987, pp. 213-216) describes several experiments…
A: F test is used to make conclusions in the anova table. Anova table is used to measure the mean…
Q: The following table gives the distribtution of weekly income of 160 families in a town : Weekly…
A: Given : n = 160
Q: The duration in minutes of 120 eruptions of Old Faithful geyser in Yellow Stone Park are provided…
A: Given is the data of 120 eruptions in minute and density histogram of the duration of eruption. The…
Q: A study of the properties of metal plate-connected trusses used for roof support yielded the…
A:
Q: The following data are the numbers of cycles to failure of aluminum test coupons subjected to…
A: We first arrange the given data of 70 observations in ascending order is as below:
Q: 4. Use the following listed chest deceleration measurements (in g, where g is the force of gravity)…
A: Hello! As you have posted 2 different questions, we are answering the first question. In case you…
Q: The following table presents measurements of mean noise levels in dBA (y), roadway width in m (x1),…
A: Enter the given data in Excel. Software procedure to obtain regression in EXCEL. Go to Data >…
Q: Consider the following n = 11 observations on shear strength of a joint bonded in a particular…
A: It was stated that the observations on shear strength of a joint bonded in particular manner is…
Q: i. 1 person/0.08 mi2 ii. 100 people/0.8 mi2 iii. 12500 people/12.5 mi2 iv. 1 person/0.008 mi2 v.
A: Given that population densities are equivalent to a density of 125
Q: 4. A material used in the construction industry contains an impurity suspected of having an adverse…
A: x p=(x-250)/50 y Δy Δ2y Δ3y Δ4y Δ5y Δ6y 100 -3 10.63 2.4…
Q: 1. Using the above data we obtain the following descriptive statistics Deaths PCRTests Admissions…
A: As per guidelines, we will only answer first three subparts. a) Daily mean deaths in the UK over…
Q: R COMMANDER OUTPUT R COMMANDER OUTPUT 32 o 38 o meat = chicken Shapiro-Wilk normality test data:…
A: Boxplots are pictorial representation of data. The line inside the box represents the median, the…
Q: An article in the Journal of Sports Science (1987, Vol. 5, pp. 261-271) presents the results of an…
A: The data is mentioned for 20 hemoglobin levels. Excel is used to obtain the mean and standard…
Q: Samples are collected from the River X and pH values are observed. 9 different pH values are listed…
A: Introduction: The formula for Bowley’s coefficient of skewness is: SkB = (Q3 –2Q2 + Q1) / (Q3 – Q1).…
Q: The article "Effect of Granular Subbase Thickness on Airfield Pavement Structural Response" (K.…
A: Hi, thanks for the question. Since there are multiple subparts posted, we will answer only first…
Q: An artide contained the folloving observations on degree of polymerization for paper specimens for…
A: Note: As per our company guidelines we are supposed to answer only first three sub-parts. Kindly…
Q: Calculate C.I, Sample Skewness and Sample Kurtosis from the following grouped data: Class 5-15 15-25…
A:
Q: The Turbine Oil Oxidation Test (TOST) and the Rotating Bomb Oxidation Test (RBOT) are two different…
A: From given data, X Y X*Y X*X Y*Y 4200 370 1554000 17640000 136900 3600 340 1224000 12960000…
Q: On graph paper, draw a scatter plotoftemperature against bowls soldto represent the data using a…
A: There is a negative linear relationship between the temperature and the number of bowls sold.
Q: A study of the relationship between age and various visual functions (such as acuity and depth…
A: given data 2.67,2.58,2.67,3.94,2.42,2.79,3.90,4.18,3.98,4.42,3.45,4.47,2.53,3.62,2.84,3.53,3.10 n =…
Q: 1. The following data table is obtained by a fourth grader on his science project, "Exploding Foam."…
A: Let X be the temperature in o F and Y be the volume ml n = number of observations = 19
Q: 1. The following data table is obtained by a fourth grader on his science project, "Exploding Foam."…
A: Part a: We compute the mean and standard deviation using the excel formulae as below:…
Q: An article contained the following observations on degree of polymerization for paper specimens for…
A:
Q: 9. The data below are the compressive strength (in psi) of 80 aluminum-lithium alloy specimens. 105…
A: Mean is the average of all the observations and it include all the observation hence there exist no…
Q: An article contained the following observations on degree of polymerization for paper specimens for…
A: Mean is the measure used to determine the average measure of the data set. Standard deviation is…
Q: A study of the relationship between age and various visual functions (such as acuity and depth…
A: Solution-: From the given data we want to calculate (a) ∑xi=? ∑xi2=? (b) sample variance s2=?…
Q: 1. Determine the degree of skewness and kurtosis of the following sets of data: a. Anxiety Level of…
A:
Q: The following data are the numbers of cycles to failure of aluminum test coupons subjected to…
A: Frequency distribution displays the frequency of various outcomes in a sample. The entries in the…
Q: The following data are the viscosity measurements for a chemical product observed hourly (read down,…
A:
Q: 8. The accompanying data on flexural strength (MPa) for concrete beams of a certain type was 5.9 7.2…
A:
Q: An article in the journal Materials Engineering (1989, Vol. II, No. 4, pp. 275–281) describes the…
A: Given: n = 22 X = 13.71 S = 3.55 Confidence level = 95% Significance level α = 0.05 Formula Used:…
Q: The following data represent the concentration of dissolved organic carbon (mg/L) collected from 20…
A: Solution: n = 20 Given data :
Q: The table below shows the data obtained from compressive strength test performed in materials…
A:
Q: An article contained the following observations on degree of polymerization for paper specimens for…
A: Box plot: Step-by-step procedure to draw the box plot using EXCEL software: Select the data and…
Q: The Turbine Oil Oxidation Test (TOST) and the Rotating Bomb Oxidation Test (RBOT) are two different…
A: Since you have posted a question with multiple sub-parts, we will solve first three subparts for…
Q: 1. In a certain type of metal test specimen, the normal stress on a specimen is known to be…
A: Given :
Q: The following data are the numbers of cycles to failure of aluminum test coupons subjected to…
A: Introduction :- We to draw stem and leaf plot for given data. Then we have to interpret it appears…
Q: Calculate the average values of the Cp and Cpk capabil-ity indices for the BOD data , assuming that…
A: The value cp and cpk is a well known capability indices value which used to understand the…
Q: 3. A manufacturer of paper used for making grocery bags is interested in improving the tensile…
A: There are 4 independent samples which are 4 types of hardwood concentrations. We have to test…
Q: The following data represent the results from the specific gravity test performed in a soil…
A: This is a grouped frequency data, we can calculate the RMS using the class mark.
Q: Population: All undergraduate SAMCIS students enrolled at SLU for the 1st Semester of AY 2021-2022.…
A: Given: Variable: Student’s major or field
Q: The following data pertain to x, the amount of fertil-izer (in pounds) that a farmer applies to his…
A: Given data:
Q: The article "Effect of Microstructure and Weathering on the Strength Anisotropy of Porous Rhyolite"…
A:
Q: (3). Consider the following data of Marks. Calculate (1) All measure of Central tendencies (2) All…
A: First Calculate mid point for every class Interval. Measure of central tendency are mean, median…
Q: In a certain type of metal test specimen, the normal stress on a specimen is known to be…
A: Given: n = 12 Formula used: The equation of best fit line is: Y = a + bX Where Y is dependent…
Trending now
This is a popular solution!
Step by step
Solved in 2 steps with 1 images
- Consider the following regression equation specied for 2-period panel data: where i = 1; 2; :::N and t = 1; 2. If you expect that β_1 is positive, but the correlation between Δx_i and Δu_i is negative, thenwhat is the bias in the OLS estimator of β_1 in the first-differenced equation?The Road Department is trying to see whether they should buy road treatments ( in tons) for storms based on the number of inches of snow for each recorded. Use Pearson r at alpha- 0.05 to test the hypothesis. ILLUSTRATE THE NORMAL CURVE inches in snow 1.5 1.7 3.7 2.8 4.6 2.4 3.1 2.9 3.6 4.2 3.1 number of tons 805 905 1235 1000 1302 998 1102 1305 1456 1600 10051. Model 1: OLS, using observations 1-706 Dependent variable: RST Coefficient Std. Error t-ratio p-value const 3586.38 38.9124 92.17 <0.0001 *** TOTWRK −0.150746 0.0167403 −9.005 <0.0001 *** Mean dependent var 3266.356 S.D. dependent var 444.4134 Sum squared resid 1.25e+08 S.E. of regression 421.1357 R-squared 0.103287 Adjusted R-squared 0.102014 F(1, 704) 81.08987 P-value(F) 1.99e-1810538.19 Log-likelihood −5267.096 Akaike criterion 10538.19 Schwarz criterion 10547.31 Hannan-Quinn 10541.71 RSTi =3586.38−0.150746 x TOTWRKi , R2=0.103287,SER=421.1357 (38.9124) (0.0167403) Question? could you please help with this question below. 3) By observing the GRETL output in Part (1) above, provide a Detailed explanation of the coefficient of determination. Based on your analysis, is this a good model? Why or why not?
- 1. Model 1: OLS, using observations 1-706 Dependent variable: RST Coefficient Std. Error t-ratio p-value const 3586.38 38.9124 92.17 <0.0001 *** TOTWRK −0.150746 0.0167403 −9.005 <0.0001 *** Mean dependent var 3266.356 S.D. dependent var 444.4134 Sum squared resid 1.25e+08 S.E. of regression 421.1357 R-squared 0.103287 Adjusted R-squared 0.102014 F(1, 704) 81.08987 P-value(F) 1.99e-1810538.19 Log-likelihood −5267.096 Akaike criterion 10538.19 Schwarz criterion 10547.31 Hannan-Quinn 10541.71 RSTi =3586.38−0.150746 x TOTWRKi , R2=0.103287,SER=421.1357 (38.9124) (0.0167403) Question? A- The researcher claims that the model lacks a fundamental principle, namely, the impact of the worker’s gender on their efficiency. The researcher further claims that Men on average take more resting time than women. To clarify the researcher’s claim, add the binary variable MALE into your model, and write down the estimated results…1. Model 1: OLS, using observations 1-706 Dependent variable: RST Coefficient Std. Error t-ratio p-value const 3586.38 38.9124 92.17 <0.0001 *** TOTWRK −0.150746 0.0167403 −9.005 <0.0001 *** Mean dependent var 3266.356 S.D. dependent var 444.4134 Sum squared resid 1.25e+08 S.E. of regression 421.1357 R-squared 0.103287 Adjusted R-squared 0.102014 F(1, 704) 81.08987 P-value(F) 1.99e-1810538.19 Log-likelihood −5267.096 Akaike criterion 10538.19 Schwarz criterion 10547.31 Hannan-Quinn 10541.71 RSTi =3586.38−0.150746 x TOTWRKi , R2=0.103287,SER=421.1357 (38.9124) (0.0167403) Question? Test the significance of the slope coefficient of the regression in Part (1) above. Use 5% level of significance on: a. Level of significance approach (show your calculations of t-ratio) b. P-value approach (show your calculation of p-value) please show the complete steps as well as the interpretation(s) involved in each of the above…1. Model 1: OLS, using observations 1-706 Dependent variable: RST Coefficient Std. Error t-ratio p-value const 3586.38 38.9124 92.17 <0.0001 *** TOTWRK −0.150746 0.0167403 −9.005 <0.0001 *** Mean dependent var 3266.356 S.D. dependent var 444.4134 Sum squared resid 1.25e+08 S.E. of regression 421.1357 R-squared 0.103287 Adjusted R-squared 0.102014 F(1, 704) 81.08987 P-value(F) 1.99e-1810538.19 Log-likelihood −5267.096 Akaike criterion 10538.19 Schwarz criterion 10547.31 Hannan-Quinn 10541.71 ????=3586.38−0.150746 ? ???????,?2=0.103287,???=421.1357 (38.9124) (0.0167403) Question? could you please help with this question below. 3) By observing the GRETL output in Part (1) above, provide a detailed explanation of the coefficient of determination. Based on your analysis, is this a good model? Why or why not?
- SOLVE QUESTIONS D & E ONLY!!!! Consider the accompanying data on flexural strength (MPa) for concrete beams of a certain type. 8.3 7.4 7.0 6.8 7.8 9.7 5.0 6.3 6.8 9.0 7.7 7.3 7.4 11.8 6.3 7.7 11.6 7.2 11.3 9.7 10.7 7.0 7.9 8.7 7.9 8.1 6.5 (a) Calculate a point estimate of the mean value of strength for the conceptual population of all beams manufactured in this fashion. [Hint: Σxi = 218.9.] (Round your answer to three decimal places.) MPa(b) Calculate a point estimate of the strength value that separates the weakest 50% of all such beams from the strongest 50%. MPa(c) Calculate a point estimate of the population standard deviation ?. [Hint: Σxi2 = 1851.35.] (Round your answer to three decimal places.) MPa(d) Calculate a point estimate of the proportion of all such beams whose flexural strength exceeds 10 MPa. [Hint: Think of an observation as a "success" if it exceeds 10.] (Round your answer to three decimal places.)(e) Calculate a point estimate of the population…Can you solve the following: and provide workings?: 1) Let there be a simple regression yt = (alpha) + (beta)x + (ε), where ε~?(0, σ^2) Let ε(hat) be an OLS estimator of ε. Prove Sum(ε(hat)) = 0 2)Let the share price of a listed company, S, have the following distribution:S~N(100,225) a)Suppose that, when the price of this share falls below the 10th percentile of itsdistribution, it is a signal for buying. What is the maximum price at which you wouldbuy this share? b) Suppose that, when the price of this share rises beyond the 90th percentile of itsdistribution, it is a signal for selling. What is the minimum price at which you wouldsell this share?You have obtained a sub-sample of 1744 individuals from the Current Population Survey (CPS) and are interested in the relationship between weekly earnings and age. The regression, using heteroskedasticity-robust standard errors, yielded the following result: = 239.16 + 3.75× Age, R2 = 0.15, SER = 287.21., where Earn and Age are measured in dollars and years respectively. Interpret the intercept? Interpret the slope coefficient b) Is the effect of age on earnings large? The average age in this sample is 37.5 years. What is annual income in the sample? (e) Interpret the measures of fit.
- 1)A new starch polymer foam with high shock absorbent properties is expected to perform better thanthe old foam which can withstand a maximum impact of 1.56 Joule (J). A simple destructive testto quantify shock absorption ability of the new foam is conducted. Table 5 shows the impact energyabsorbed (in J) that the new foam can withstand for each test. Table 51.61 1.5 1.65 1.7 1.4 1.59 1.65 1.5 Does the recorded data suggests that the new foam performs better than the old foam? Use 2.5%level of significance. 2) A number of 28 university students who smokes completed a questionnaire inquiring their smokinghistory and behavior. The result shows that the average smoking initiation age of this group is 21.6years with a variance of 18.49. Based on past record, the smoking initiation age of universitystudent has a mean of 20.74 years with a standard deviation of 5.1 years. Conduct a necessaryanalysis to determine if the smoking initiation age remain the same as the previous record.…Consider the following population linear regression model of individual food expenditure: Y = 50 + 0.5X + u, where Y is weekly food expenditure in dollars, X is the individual’s age, and 50+0.5X is the population regression line. Suppose we generate artificial data for 3 individuals using this model. This artificial sample, which consists of 3 observations, is shown in the following table: Answer the following questions. Show your working. (a) What are the values of V1 and V4? (b) Suppose we know that in this artificial sample, the sample covariance between X and Y is 150, and the sample variance of X is 100. Compute the OLS regression line of the regression of Y on X. (Hint: Assume these summary statistics and the OLS regression line continue to hold in parts (c)-(e).) (c) What are the values of V5 and V7?A dietitian wishes to see if a person’s cholesterol level will be changed if the diet is supplemented by a certain mineral. Four subjects were pre-tested, and they took the mineral supplement for a 6-week period. The results are shown in the table. Is there sufficient evidence to conclude that the population mean of cholesterol levels has been changed after six weeks at α=0.2α=0.2? Assume that the differences are from an approximately normally distributed population. Subject Cholestrol Level (mg/dl) Cholestrol Level after 6 Weeks (mg/dl) dd ¯dd¯ (d−¯d)2(d-d¯)2 1 206 217 11 2 219 184 -35 3 202 204 2 4 213 205 -8 Total -30 a) Calculate the mean, the sum of the squared deviation from the mean, and the standard deviation of differences. Do not include the unit for each answer: ¯d=d¯= (do not round) ∑(d−¯d)2=∑(d-d¯)2= (do not round) sd=sd= (rounded to one decimal place) b) Perform the hypothesis test in the following steps: Step 1.…