1. What is the equilibrium price and quantity based on the following demand and supply equations? Solve by putting Qd = Qs Qd = 10-P Qs = P Quantity is given from 0 to 10 units on the x-axis. Price is given from $0.00 to $10.00 on the y-axis. Plot the Supply and Demand curves. 2. Now draw the Demand and Supply curves using the following Demand and Supply Schedule: Demand Schedule: QP 이 11 21 31 31 41 41 51 51 3. From number 2, draw a graph and call the equilibrium point (Point A). Illustrate on the graph what will happen to the Demand curve when consumers' income decreases? Supply Schedule: Q|P OF N 이 11 4. From number 2, draw another graph and call equilibrium Point A. Illustrate on the graph what will happen to the Supply curve when producers enter the market?
1. What is the equilibrium price and quantity based on the following demand and supply equations? Solve by putting Qd = Qs Qd = 10-P Qs = P Quantity is given from 0 to 10 units on the x-axis. Price is given from $0.00 to $10.00 on the y-axis. Plot the Supply and Demand curves. 2. Now draw the Demand and Supply curves using the following Demand and Supply Schedule: Demand Schedule: QP 이 11 21 31 31 41 41 51 51 3. From number 2, draw a graph and call the equilibrium point (Point A). Illustrate on the graph what will happen to the Demand curve when consumers' income decreases? Supply Schedule: Q|P OF N 이 11 4. From number 2, draw another graph and call equilibrium Point A. Illustrate on the graph what will happen to the Supply curve when producers enter the market?

Brief Principles of Macroeconomics (MindTap Course List)
8th Edition
ISBN:9781337091985
Author:N. Gregory Mankiw
Publisher:N. Gregory Mankiw
Chapter4: The Market Forces Of Supply And Demand
Section: Chapter Questions
Problem 8PA

Related questions
Question
How do I solve by putting Qd = Qs?
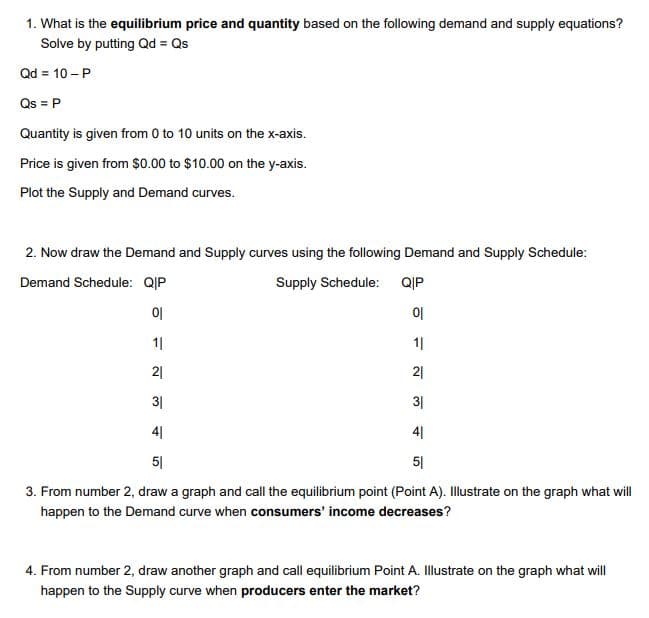
Transcribed Image Text:1. What is the equilibrium price and quantity based on the following demand and supply equations?
Solve by putting Qd = Qs
Qd = 10 - P
Qs = P
Quantity is given from 0 to 10 units on the x-axis.
Price is given from $0.00 to $10.00 on the y-axis.
Plot the Supply and Demand curves.
2. Now draw the Demand and Supply curves using the following Demand and Supply Schedule:
Demand Schedule: Q|P
Supply Schedule: Q|P
이
이
11
11
21
21
31
31
41
41
51
51
3. From number 2, draw a graph and call the equilibrium point (Point A). Illustrate on the graph what will
happen to the Demand curve when consumers' income decreases?
4. From number 2, draw another graph and call equilibrium Point A. Illustrate on the graph what will
happen to the Supply curve when producers enter the market?
Expert Solution
This question has been solved!
Explore an expertly crafted, step-by-step solution for a thorough understanding of key concepts.

This is a popular solution!

Trending now
This is a popular solution!

Step by step
Solved in 4 steps with 3 images

Knowledge Booster


Learn more about
Need a deep-dive on the concept behind this application? Look no further. Learn more about this topic, economics and related others by exploring similar questions and additional content below.Recommended textbooks for you
Brief Principles of Macroeconomics (MindTap Cours…
Economics
ISBN:
9781337091985
Author:
N. Gregory Mankiw
Publisher:
Cengage Learning

Principles of Microeconomics
Economics
ISBN:
9781305156050
Author:
N. Gregory Mankiw
Publisher:
Cengage Learning

Brief Principles of Macroeconomics (MindTap Cours…
Economics
ISBN:
9781337091985
Author:
N. Gregory Mankiw
Publisher:
Cengage Learning
Principles of Microeconomics
Economics
ISBN:
9781305156050
Author:
N. Gregory Mankiw
Publisher:
Cengage Learning


Exploring Economics
Economics
ISBN:
9781544336329
Author:
Robert L. Sexton
Publisher:
SAGE Publications, Inc
