1. What is the total area under the curve for a standard normal distribution? 2. In a standard normal distribution, what percentage of the area falls below the mean? 3. In a standard normal distribution, what percentage of the area under the curve falls within 1 standard deviation of the mean? What percentage of the area falls within 2 standard deviations of the mean?
1. What is the total area under the curve for a standard normal distribution? 2. In a standard normal distribution, what percentage of the area falls below the mean? 3. In a standard normal distribution, what percentage of the area under the curve falls within 1 standard deviation of the mean? What percentage of the area falls within 2 standard deviations of the mean?

MATLAB: An Introduction with Applications
6th Edition
ISBN:9781119256830
Author:Amos Gilat
Publisher:Amos Gilat
Chapter1: Starting With Matlab
Section: Chapter Questions
Problem 1P

Related questions
Question
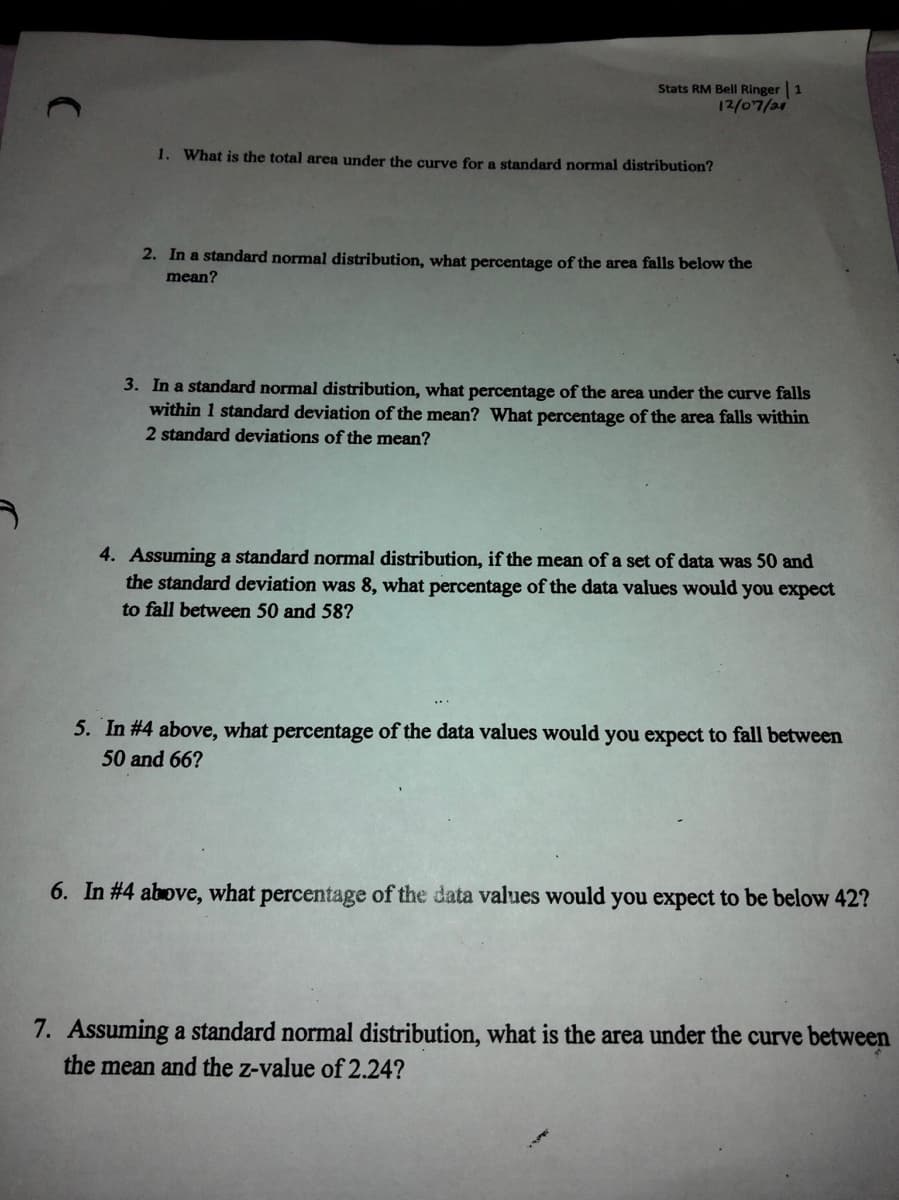
Transcribed Image Text:Stats RM Bell Ringer 1
12/07/21
1. What is the total area under the curve for a standard normal distribution?
2. In a standard normal distribution, what percentage of the area falls below the
mean?
3. In a standard normal distribution, what percentage of the area under the curve falls
within 1 standard deviation of the mean? What percentage of the area falls within
2 standard deviations of the mean?
4. Assuming a standard normal distribution, if the mean of a set of data was 50 and
the standard deviation was 8, what percentage of the data values would you expect
to fall between 50 and 58?
5. In #4 above, what percentage of the data values would you expect to fall between
50 and 66?
6. In #4 above, what percentage of the data values would you expect to be below 42?
7. Assuming a standard normal distribution, what is the area under the curve between
the mean and the z-value of 2.24?
Expert Solution
This question has been solved!
Explore an expertly crafted, step-by-step solution for a thorough understanding of key concepts.

This is a popular solution!

Trending now
This is a popular solution!

Step by step
Solved in 4 steps with 1 images

Recommended textbooks for you
MATLAB: An Introduction with Applications
Statistics
ISBN:
9781119256830
Author:
Amos Gilat
Publisher:
John Wiley & Sons Inc

Probability and Statistics for Engineering and th…
Statistics
ISBN:
9781305251809
Author:
Jay L. Devore
Publisher:
Cengage Learning

Statistics for The Behavioral Sciences (MindTap C…
Statistics
ISBN:
9781305504912
Author:
Frederick J Gravetter, Larry B. Wallnau
Publisher:
Cengage Learning
MATLAB: An Introduction with Applications
Statistics
ISBN:
9781119256830
Author:
Amos Gilat
Publisher:
John Wiley & Sons Inc
Probability and Statistics for Engineering and th…
Statistics
ISBN:
9781305251809
Author:
Jay L. Devore
Publisher:
Cengage Learning
Statistics for The Behavioral Sciences (MindTap C…
Statistics
ISBN:
9781305504912
Author:
Frederick J Gravetter, Larry B. Wallnau
Publisher:
Cengage Learning

Elementary Statistics: Picturing the World (7th E…
Statistics
ISBN:
9780134683416
Author:
Ron Larson, Betsy Farber
Publisher:
PEARSON

The Basic Practice of Statistics
Statistics
ISBN:
9781319042578
Author:
David S. Moore, William I. Notz, Michael A. Fligner
Publisher:
W. H. Freeman

Introduction to the Practice of Statistics
Statistics
ISBN:
9781319013387
Author:
David S. Moore, George P. McCabe, Bruce A. Craig
Publisher:
W. H. Freeman