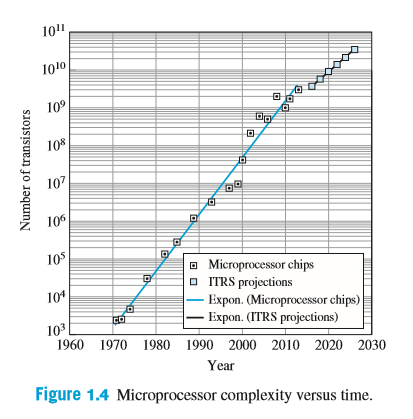
10" 1010 10 108 107 106 105 O Microprocessor chips O ITRS projections Expon. (Microprocessor chips) ·Expon. (ITRS projections) 104 10 1960 1970 1980 1990 2000 2010 2020 2030 Year Figure 1.4 Microprocessor complexity versus time. Number of transistors


Q: The lower line in Fig. 1.4 is described by N = 1327×10(Year-1970)/6.521970)/6.52.Based on a…
A:
Q: Year Gas Price Index Value 2000 $1.48 [A] 2006 $2.57 [B] 2008 $3.25 [C] 2012 $3.62 [D] Build an…
A:
Q: Predict the annual salary in dollars for a mathematics instructor with 10 years of experience.…
A:
Q: A municipal solid-waste site for a city must be located at Site A or Site B. After sorting, some of…
A: Concept: The calculus helps in understanding the changes between values that are related by a…
Q: The table given below indicates Small Holding Ltd.'s quarterly profits in 2019 and 2020. Time Period…
A: Regression: Regression defines the relationship of dependent variable with two or more independent…
Q: Two 100-horsepower motors are being considered for use in the following table: Brand X Brand Y…
A: Two 100 horse power motors are being considered to sue in the table, Brand X Brand Y…
Q: 2. The following table shows the estimated populations and annual growth rates for four countries in…
A:
Q: Complete the table shown to the right for the population growth model for a certain country. 2006…
A: Topic = Algebra
Q: by (i) Laspeyre's Calculate quantity index method, (ii) Paasche's method, and (iii) Fisher's…
A:
Q: Complete the table shown to the right for the population growth model for a certain country. 2007…
A:
Q: Compute a three- year moving average year No. product 2000 2001 2002 2003 2004 3. 2005 7. 7 ata 6
A: The moving average method is an improvement over semi-average method as short term fluctuation are…
Q: 10 13 136 O Compute the residuals. Years of Annual Sales Residuals Experience ($1,000s) 80 97 4 92…
A: Annual Sales Residuals 80 -5 97 4 92 -5 107 10 103 -2 111 -2 119 -2 128 7 117 -8…
Q: Use tables to express and represent the descriptive statistics for the variables below. Years…
A: Measure of central tendency and Measure of dispersion are used for the description of the data set…
Q: 5. The following table displays the number of HIV diagnoses per year in a particular country. Year…
A:
Q: Suppose a renewable population grows logistically according to 768 N = 1 + 5e-0.06t According to the…
A:
Q: 6 1 point How many years does it take for the following ecosystem to reach its climax community (1)…
A: A climax community is one that has reached the stable stage. When extensive and well defined, the…
Q: 11. In 2010 consumption (Ci) for selected countries was as follows Jordan 2.5 billion $, USA 100…
A: ESS is the Explained sum of squares (also known as SS due to regression) of a linear regression…
Q: The following table shows the total spent on research and development by industry in a country, in…
A: From the given information, t ln(t) S(t) 2 0.693147 193 3 1.098612 196 4 1.386294 196 5…
Q: 5. Consider that in 1915 that the population in the United States was 100 million. Suppose the…
A: Given In 1915, the population size=100 million In 1915, the growth rate=1 million people per year…
Q: Final Initial Feed Weight Weight Weight 95 42 272 77 33 226 80 33 259 100 45 292 97 39 311 70 36 183…
A: The dependent variable is Final Weight. The independent variables are Initial weight and Feed…
Q: 2)- Industrial engineers periodically conduct "work measurement' analysis to determine the time…
A: Answer for a) Mean= 117.82 Median = 117.5 Mode = 97,112,124,128, and 131
Q: Complete the following table and estimate GDP by income. (Title this activity as "Unit 8 Activity'…
A: Given :Complete the following table and estimate GDP by Income.
Q: particular year the population of a country spent $10.5 trillion in personal consumption. The major…
A: Solution
Q: Cell phone subscribers Year Top U.S. law firms gross revenue (in million dolları (in thousands) 1989…
A: Let us consider the numbers of Cell phone subscribers (in thousands) to be X and the Top U.S. law…
Q: Refer to the information provided in Table 6.10 below to answer the question(s) that follow. Table…
A:
Q: Suppose a family required $41,605 in 1985 to maintain its standard of living. What income would have…
A: Given - Suppose a family required $41,605 in 1985 to maintain its standard of living. To find -…
Q: Please help. Thank you. CSV file data is below. TSERofReturn AcmeRofReturn -1.99167…
A: Since you have posted a question with multiple sub-parts, we will solve first three subparts for…
Q: Kaitlyn measures the upload speed in megabits per second of her home broadband internet connection…
A: Median: It is the middle value of the data that separate the data into two equal half. The median…
Q: DATA 3. (18 breeds of dogs, body weight of each dog (in pounds), and the amount of food consumed in…
A: Given,
Q: table below and assume a population of 314 million. How much greater is the risk of death from…
A: We have to check which disease is more risky.
Q: 3.20 Table 3.3 shows the number of athletes who stretch before exercising and how many had injuries…
A:
Q: 12. In 2010 consumption (Ci) for selected countries was as follows Jordan 2.5 billion $, USA 100…
A: Given the data as Country Yi Ci Jordan 12 2.5 USA 900 100 Canada 700 50 France 500 40…
Q: 2)- Industrial engineers periodically conduct "work measurement' analysis to determine the time…
A: Arrange the given data in ascending order: 88, 92, 95, 97, 97, 97, 98, 98, 100, 100, 103, 108, 109,…
Q: Are cigarettes bad for people? Cigarette smoking involves tar, carbonmonoxide, and nicotine. The…
A: Are cigarettes bad for people? Cigarette smoking involves tar, carbonmonoxide, and nicotine. The…
Q: Let's examine labor force participation in October 2019, July 2020, and October 2020 Household…
A: Labor Force Participation rate: It is the percentage of the population that is either working or…
Q: 2)- Industrial engineers periodically conduct "work measurement' analysis to determine the time…
A:
Q: The design life of a planned municipal water-distribution system is to end in 2050, and the…
A: Regression Analysis Regression Analysis helps to estimate the relationship between one…
Q: Table 3.2 Exports, Imports and Balance of Trade of India, 1993-94 to 1999-2000 (Rs '000 crore)…
A:
Q: Table 2. Total oil production in millions of tons for Saudi Arabia from 1996-2013 Forecast Demand,…
A: The forecasting for the total oil production (in millions) is to be concluded using the simple…
Q: Price SqFt 600000 2767 545000 2731 314900 2051 419000 2084 365000 2270 479000 1950 323000 1235…
A: By using the spreadsheet, perform the simple linear regression by taking square feet as the…
Q: Miami Central som:. 16. 15. (3500, 460), 1000 450 (3,860 900 400 800 350 (5) 700 * 300 (1000, 310)…
A: In this question we will use basic of algebra i.e equation of straight line when two points are…
Q: 2)- Industrial engineers periodically conduct "work measurement' analysis to determine the time…
A: Solution : c) Given : n = 50 Let, Y : Number of total worker hours required per day to perform a…
Q: a. Confirm the intercept, slope and correlation coefficient by computing them.
A: Income (X) Units (Y) (x-xbar) (x-xbar)^2 (y-ybar) (y-ybar)^2 (x-xbar)*(y-ybar) 16368 1190882…
Q: 5. Graphed on the same axes below, population and energy use are compared over 80 years. Which of…
A:
Q: Study the chart below. In the year that the US had its maximum production of ethanol, how many…
A:
Q: 5. Estimate the production for the years 2008 and 2010 with the help d following table : Year…
A:
Q: Below is a line graph of the storage capacities measured in MegaLitres (ML), from the supplier dams…
A:
Q: Annual revenue (in million dollars) earned by the CrazyNet are provided below. Year 2001 2002 2003…
A: Hello! As you have posted more than 3 sub parts, we are answering the first 3 sub-parts. In case…
Q: QUESTION: From the given table, compute for the crude birth rate for every 1000 population in…
A: The birth rate explains the number of birth per 1000. The crude birth rate per 1000 is calculated by…
The upper line as shown is described by
N = (2.233 × 109) × 10(Year-2014)/10.1. Based upon a straight-line projection, estimate the number of transistors in a complex IC chip in the year 2021.

Step by step
Solved in 2 steps with 2 images


- A municipal solid-waste site for a city must be located at Site A or Site B. After sorting, some of the solid refuse will be transported to an electric powerplant where it will be used as fuel. Data for the hauling of refuse from each site to the power plant are shown in Table P2-4. If the power plant will pay $8.00 per cubic yard of sorted solid waste delivered to the plant, where should the solid-waste site be located? Use the city’s viewpoint and assume that 200,000 cubic yards of refuse will be hauled to the plant for one year only. One site must be selected.The Boeing Company faces a critical strategic choice in its competition with Airbus Industries for the long-haul flight segment: Should it design and build a super-747 model that can carry 550 passengers at speeds around 350 mph, or a plane that can fly at 95 percent of the speed of sound but carry only about 350 passengers? As a member of Boeing's Planning Group, your task is to build a model to investigate the trade-offs involved in this decision.The production planning period for flat-screen moni-tors at Louisiana’s Roa Electronics, Inc., is 4 months. Cost data are as follows:Regular-time cost per monitor $ 70Overtime cost per monitor $110Subcontract cost per monitor $120Carrying cost per monitor per month $ 4 For each of the next 4 months, capacity and demand for flat-screen monitors are as follows: PERIOD MONTH 1 MONTH 2 MONTH 3 a MONTH 4Demand 2,000 2,500 1,500 2,100CapacityRegular time 1,500 1,600 750 1,600Overtime 400 400 200 400Subcontract 600 600 600 600aFactory closes for 2 weeks of vacation.CEO Mohan Roa expects to enter the planning period with 500monitors in stock. Back ordering is not permitted (meaning, forexample, that monitors produced in the second month cannot beused to cover first month’s demand). Develop a production planthat minimizes costs using the transportation method.
- Two pumps capable of delivering 100 hp to an agricultural application are being evaluated in a present economy study. The selected pump will only be utilized for one year, and it will have no market value at the end of the year. Pertinent data are summarized as given follows. If electric power costs $0.10 per kWh and the pump will be operated 4,000 hours per year, which pump should be chosen? Recall that 1 hp = 0.746 kW.The manager of the purchasing department of a large banking organization would like to develop a model to predict the amount of time it takes to process invoices. Data are collected from a sample of 30 days with the following results: Relating time to invoices processed. Day Invoices Processed Completion Time (hours) Day Invoices Processed Completion Time (hours) 1 149 2.1 16 169 2.5 2 60 1.8 17 190 2.9 3 188 2.3 18 233 3.4 4 19 0.3 19 289 4.1 5 201 2.7 20 45 1.2 6 58 1.0 21 193 2.5 7 77 1.7 22 70 1.8 8 222…Floyd Distributors, Inc., provides a variety of auto parts to small local garages. Floyd purchases parts from manufacturers according to the EOQ model and then ships the parts from a regional warehouse direct to its customers. For a particular type of muffler, Floyd's EOQ analysis recommends orders with Q* = 20 to satisfy an annual demand of 180 mufflers. Floyd's has 250 working days per year, and the lead time averages 15 days.Note: Use Appendix B to identify the areas for the standard normal distribution. What is the reorder point if Floyd assumes a constant demand rate? If required, round your answer up to the nearest whole number. r = fill in the blank 1 Suppose that an analysis of Floyd's muffler demand shows that the lead-time demand follows a normal probability distribution with µ = 12 and σ = 2.2. If Floyd's management can tolerate one stock-out per year, what is the revised reorder point? If required, round your answer up to the nearest whole number. r = fill in the blank…
- Table 1. The manager of Carpet City outlet store needs to be able to forecast accurately demand for Soft Shang carpet. Demand for the past 20 weeks appears in table 1 below. week Demand Forecast Error ABS. Dev Squared Error APE 1 20 2 28 3 22 4 18 5 22 6 22 7 22 8 26 9 23 10 23 11 23 12 27 13 25 14 22 15 23 16 14 17 14 18 15 19 11 20 16 21 22 23 24…Use this data and and generate a model of the annual maintenance expenses based on the age of the bug. If my bus is 4.1 years old, what are the projected annual maintenance costs? (Enter a whole number) Age of Bus (years) Annual Maintenance Cost ($) 2.4 350 2.3 370 2.4 480 3.1 520 3 590 5.8 550 4.8 750 3.8 800 3.6 790 4.9 950 5.5 915Use the basic equation for the capital asset pricing model (CAPM) to Find the risk-free rate for a firm with a required return of 15% and a beta of 1.25 when the market return is 14%
- Compute the forecasted values for Yt for July and August in 2020 by using the modelsstated in (c) and (d)Kaitlyn measures the upload speed in megabits per second of her home broadband internet connection during peak hours and off-peak hours. The results are provided in the accompanying table. Peak Off-Peak 5.83 5.14 6.05 6.80 7.14 6.98 3.54 5.77 5.45 7.27 5.90 6.62 5.81 6.19 4.82 6.08 6.37 6.59 4.65 5.58 5.30 7.41 6.48 6.26 5.96 6.37 5.79 6.31 6.84 6.55 5.06 4.95 5.61 7.03 6.45 6.77 Examine the results of Kaitlyn's test to determine the statements that compare the medians and interquartile ranges of the data sets to each other in terms of this situation. Select the two correct answers. The median upload speed during peak hours is 5.905 megabits per second, which is less than the median upload speed during off-peak hours, 7.005 megabits per second. The upload speeds during peak hours are slower on average compared to off-peak times. The median upload speed during peak hours is 6.37 megabits per second, which is greater than the median upload speed during…Given that a zone has 350 households with access to cars and 295 households without access to cars and the average trip generation rates for each group are 4.0 and 2.0 trips per day, respectively. Assuming that in the future, households will have similar distribution with access and without access to a car, as per the existing situation. There will be an addition of 650 households with a similar distribution of car ownership. Find the growth factor and future trips from that zone.