10.00 9.00 MC 8.00 ATC 7.00 6.00 5.00 4.00 3.00 8 2.00 1.00 MR 10 20 30 40 50 Quantity (hamburgers per hour) a) Ron's Hamburger Joint is the only restaurant in town. The above figure represents Ron's cost, demand, and marginal revenue curves. Ron operates as a single-price monopoly. i) ii) iii) How many hamburgers does Ron produce? What price does Ron charge for a hamburger? What is Ron's economic profit? b) Draw the MC and ATC curve. Describe THREE (3) relationships between the MC and ATC curve. c) Draw A perfectly competitive firm that earns profits. Price and cost (dollars per hamburger)
10.00 9.00 MC 8.00 ATC 7.00 6.00 5.00 4.00 3.00 8 2.00 1.00 MR 10 20 30 40 50 Quantity (hamburgers per hour) a) Ron's Hamburger Joint is the only restaurant in town. The above figure represents Ron's cost, demand, and marginal revenue curves. Ron operates as a single-price monopoly. i) ii) iii) How many hamburgers does Ron produce? What price does Ron charge for a hamburger? What is Ron's economic profit? b) Draw the MC and ATC curve. Describe THREE (3) relationships between the MC and ATC curve. c) Draw A perfectly competitive firm that earns profits. Price and cost (dollars per hamburger)

Economics: Private and Public Choice (MindTap Course List)
16th Edition
ISBN:9781305506725
Author:James D. Gwartney, Richard L. Stroup, Russell S. Sobel, David A. Macpherson
Publisher:James D. Gwartney, Richard L. Stroup, Russell S. Sobel, David A. Macpherson
Chapter24: Price-searcher Markets With High Entry Barriers
Section: Chapter Questions
Problem 13CQ

Related questions
Question
i need in words
no handwritten
Transcribed Image Text:Question 2
10.00
9.00
MC
8.00
ATC
7.00
6.00
5.00
4.00
言 3.00
8 2.00
1.00
MR.
10
20
30
40
50
Quantity (hamburgers per hour)
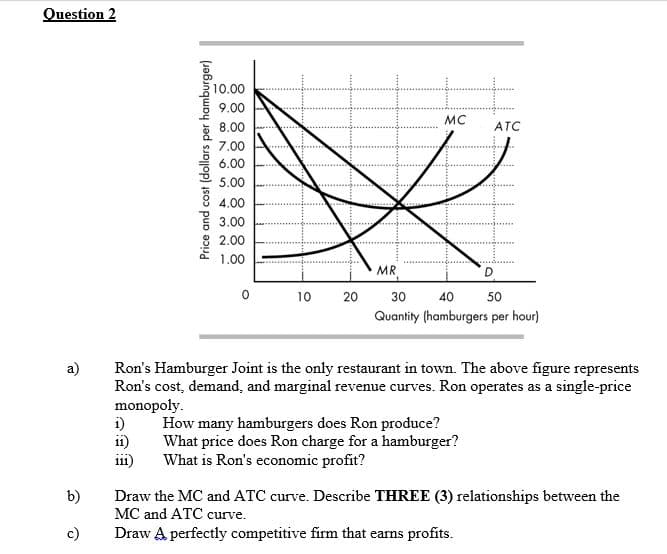
a)
Ron's Hamburger Joint is the only restaurant in town. The above figure represents
Ron's cost, demand, and marginal revenue curves. Ron operates as a single-price
monopoly.
i)
i1)
How many hamburgers does Ron produce?
What price does Ron charge for a hamburger?
What is Ron's economic profit?
111
b)
Draw the MC and ATC curve. Describe THREE (3) relationships between the
MC and ATC curve.
c)
Draw A perfectly competitive firm that earns profits.
Price and cost (dollars per hamburger)
Expert Solution
This question has been solved!
Explore an expertly crafted, step-by-step solution for a thorough understanding of key concepts.

This is a popular solution!

Trending now
This is a popular solution!

Step by step
Solved in 2 steps with 2 images

Recommended textbooks for you
Economics: Private and Public Choice (MindTap Cou…
Economics
ISBN:
9781305506725
Author:
James D. Gwartney, Richard L. Stroup, Russell S. Sobel, David A. Macpherson
Publisher:
Cengage Learning

Microeconomics: Private and Public Choice (MindTa…
Economics
ISBN:
9781305506893
Author:
James D. Gwartney, Richard L. Stroup, Russell S. Sobel, David A. Macpherson
Publisher:
Cengage Learning

Managerial Economics: Applications, Strategies an…
Economics
ISBN:
9781305506381
Author:
James R. McGuigan, R. Charles Moyer, Frederick H.deB. Harris
Publisher:
Cengage Learning
Economics: Private and Public Choice (MindTap Cou…
Economics
ISBN:
9781305506725
Author:
James D. Gwartney, Richard L. Stroup, Russell S. Sobel, David A. Macpherson
Publisher:
Cengage Learning
Microeconomics: Private and Public Choice (MindTa…
Economics
ISBN:
9781305506893
Author:
James D. Gwartney, Richard L. Stroup, Russell S. Sobel, David A. Macpherson
Publisher:
Cengage Learning
Managerial Economics: Applications, Strategies an…
Economics
ISBN:
9781305506381
Author:
James R. McGuigan, R. Charles Moyer, Frederick H.deB. Harris
Publisher:
Cengage Learning


Managerial Economics: A Problem Solving Approach
Economics
ISBN:
9781337106665
Author:
Luke M. Froeb, Brian T. McCann, Michael R. Ward, Mike Shor
Publisher:
Cengage Learning