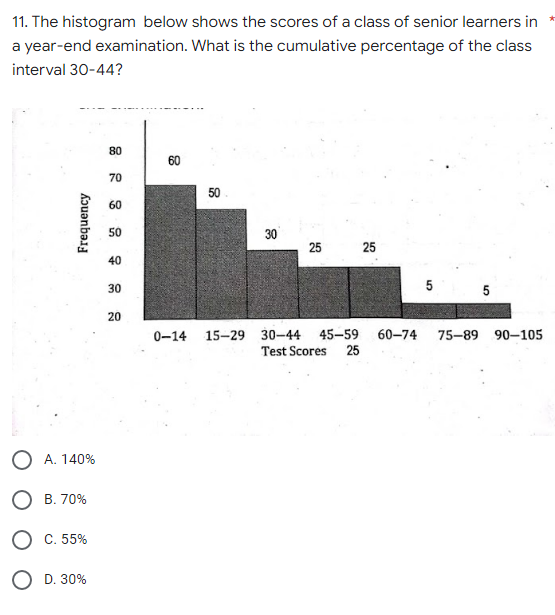
11. The histogram below shows the scores of a class of senior learners in a year-end examination. What is the cumulative percentage of the class interval 30-44? 80 60 70 60 50 30 25 25 40 30 5 20 0-14 15-29 30-44 45-59 60-74 75-89 90-105 Test Scores 25 Frequency O A. 140% O B. 70% O C. 55% O D. 30% 50 1
11. The histogram below shows the scores of a class of senior learners in a year-end examination. What is the cumulative percentage of the class interval 30-44? 80 60 70 60 50 30 25 25 40 30 5 20 0-14 15-29 30-44 45-59 60-74 75-89 90-105 Test Scores 25 Frequency O A. 140% O B. 70% O C. 55% O D. 30% 50 1

Functions and Change: A Modeling Approach to College Algebra (MindTap Course List)
6th Edition
ISBN:9781337111348
Author:Bruce Crauder, Benny Evans, Alan Noell
Publisher:Bruce Crauder, Benny Evans, Alan Noell
Chapter5: A Survey Of Other Common Functions
Section5.3: Modeling Data With Power Functions
Problem 6E: Urban Travel Times Population of cities and driving times are related, as shown in the accompanying...

Related questions
Question
Transcribed Image Text:11. The histogram below shows the scores of a class of senior learners in
a year-end examination. What is the cumulative percentage of the class
interval 30-44?
80
70
50
60
50
30
25
25
40
30
5
5
20
0-14 15-29 30-44 45-59 60-74
75-89 90-105
Test Scores 25
Frequency
A. 140%
B. 70%
C. 55%
D. 30%
Expert Solution
This question has been solved!
Explore an expertly crafted, step-by-step solution for a thorough understanding of key concepts.

This is a popular solution!

Trending now
This is a popular solution!

Step by step
Solved in 2 steps

Recommended textbooks for you
Functions and Change: A Modeling Approach to Coll…
Algebra
ISBN:
9781337111348
Author:
Bruce Crauder, Benny Evans, Alan Noell
Publisher:
Cengage Learning
Functions and Change: A Modeling Approach to Coll…
Algebra
ISBN:
9781337111348
Author:
Bruce Crauder, Benny Evans, Alan Noell
Publisher:
Cengage Learning