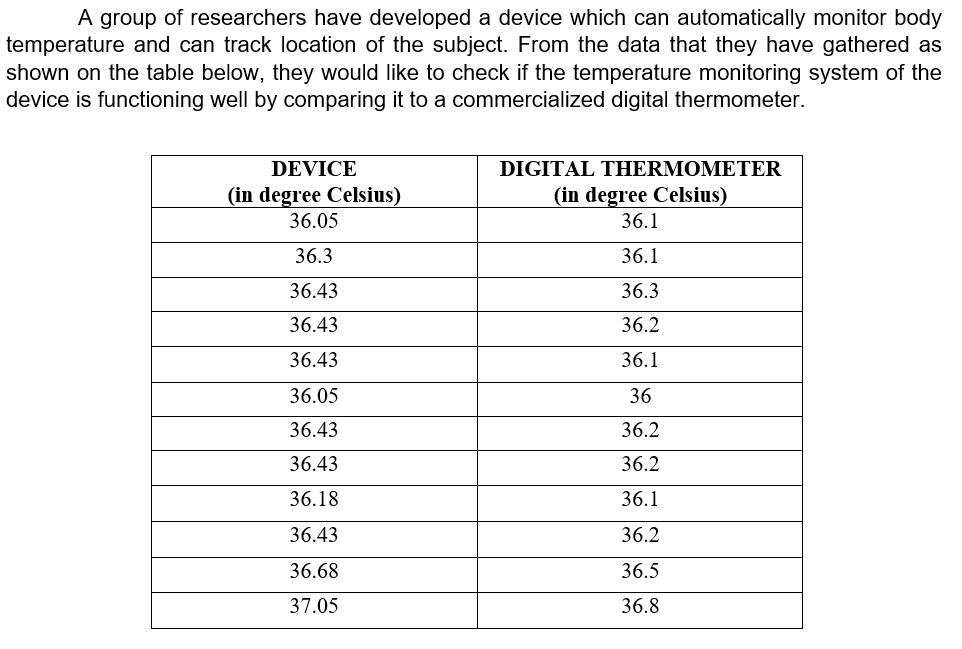
A group of researchers have developed a device which can automatically monitor bo perature and can track location of the subject. From the data that they have gathered wn on the table below, they would like to check if the temperature monitoring system of ice is functioning well by comparing it to a commercialized digital thermometer. DEVICE DIGITAL THERMOMETER (in degree Celsius) (in degree Celsius) 36.1 36.05 36 3 36 1


Q: Question 2. An industrial engineer wishes to test the effect of four chemical agents on the strength…
A:
Q: QUESTION 4 Agree or disagree with the following statements about using the repeated measures design.…
A: Hi! Thank you for the question, As per the honor code, we are allowed to answer one question with…
Q: The following boxplot represents data from an experiment using pendulums designed to estimate the…
A: Consider the box plot that represents the data from an experiment using pendulums designed to…
Q: Given y; = Bo + B1(x; – µ) + ɛ¿ , find the OLS estimator for B1. Is this estimator unbiased? Why or…
A: Given Information: yi=β0+β1xi-μ+εi
Q: 10.33 Runners and Cyclists Chronic anterior compartment syndrome is a condition characterized by…
A: Introduction: Part a requires testing for the “Condition” given in the question in the row “Rest”;…
Q: Listed below are measured amounts of greenhouse gas emissions from cars in three different…
A: State the hypotheses.
Q: Dr. Castillejo feels that maximum pulse rate during the run is a good predictor in explaining the…
A: Regression line are used to predict the future variable over the other. It shows the relationship…
Q: The figure below is a partition curve for a heavy media cyclone processing coal. a) What is the d50…
A: Normalized error is a statistical evaluation used to compare proficiency testing results where the…
Q: a.2. Solve for the Bartlett’s critical value using α = 0.01. a.3. Conclude if the variances are…
A: 67 72 75 79 93 94 96 89 95 95 97 90 91 95 98 88 97 96 98 91 96 98 97 90 97…
Q: Which of the following will help us get precise beta estimates? O Lots of data O Lots of variation…
A: 19) The correct answer is "Lots of variation in the RHS variable".
Q: According to the Keiser Family Foundation, 84% of US children 8 to 18 had internet access at home in…
A: Given : Percentages of each scenario, hence the parameter p is used .
Q: Carbon monoxide (CO) concentrations are sampled at 20 intersections in heavy-traffic areas of a…
A: Level of Significance is the probability of rejecting a null hypothesis when it is true. In other…
Q: An environmental group took a sample from a river under study to check on the biochemical oxygen…
A:
Q: Mercury is a persistent and dispersive environmental contaminant found in many ecosystems around the…
A: a) Mean = 1.24 median = 0.57 There is heavy positive skewness in the data.
Q: ASK TOur Teacher The propagation of fatigue cracks in various aircraft parts has been the subject of…
A:
Q: Polyester fiber ropes are increasingly being used as components of mooring lines for offshore…
A:
Q: Are the following results significant at α=.01? F(2,27) =10.56, p=.02 Yes No 2. A large F-ratio…
A: 1. The F statistic and corresponding p value are F(2,27) =10.56, p =.02 respectively.
Q: A psychologist is interested in the relationship between people born during three different decades…
A: Given: Decade Born Like Social Media <80's 90's 00's Yes 30 39 51 No 40 21 19
Q: In a study by Wang et al. (A-6), researchers examined bone strength. They collected 10 cadaveric…
A: Introduction: The study aims to compare the force required to fracture the cadaveric femur bones of…
Q: A paper gives data on x- change in Body Mass Index (BMI, in kilograms/meter*) and y- change in a…
A:
Q: A dentist wanted to determine if a relationship existed between childhood fluoride exposure and…
A: Let ρ denotes the population correlation between years of fluoride and number of cavities. The test…
Q: Laptop Computers and Sperm Count Studies have shown that heating the scrotum by just 1∘C can reduce…
A: a) Mean x=2.31 Standard deviation s=0.96 The 95% of data will occur in 2 standard deviation within…
Q: Part 4 of 5 (d) Test the significance of the correlation coefficient at a = 0.01, using The Critical…
A:
Q: A sample of men and women who had passed their driver's test either the first time or the second…
A:
Q: A highway department is studying the relationship between traffic flow and speed. The following…
A:
Q: Answer the whole page for number eight please.
A: The null and the alternative hypotheses are given below:H0: The mean assembly time taken by two…
Q: Which of the following accurately describes the effect of increasing the alpha level? Question…
A: Correct Answer Option D Increases the risk of a Type I error and has no effect on the standard error
Q: Use the information below to answer Questions #16 - 22. The article "Probabilistic Fatigue…
A: Exponential Distribution: A continuous random variable X is said to follow Exponential distribution…
Q: The director of an alumni association wants to determine whether there is any type of relationship…
A:
Q: A study sought to demonstrate that soy beans inoculated with nitrogen-fixing bacteria yield more.…
A: State the hypotheses. That is, there is no evidence that the mean pod weight exceeds the mean of…
Q: A researcher wanted to determine if carpeted rooms contain more bacteria than uncarpeted rooms. The…
A: Given that : X represent carpeted Y represents uncarpeted By using two sample t test we get…
Q: Based on the data presented below, at an alpha = 0.05, which is true %3D
A: Hypotheses: H0:μ1=μ2=μ3H1: At least one μi is different.
Q: A researcher wanted to determine if carpeted rooms contain more bacteria than uncarpeted rooms. The…
A: The P-value value is obtained by using EXCEL. The software procedure is given below: Enter the…
Q: For each of the following situations, identify whether the appropriate test is a paired t-test (for…
A: Determine whether the given scenario represents the paired t test or two sample t test.. The…
Q: QUESTION 8 STAT1000E2twopopS2021.pdf The owner of a service station wants to determine if owners of…
A: For the given small sample size (i.e n<30) with the population standard deviation unknown, we…
Q: An article contained the following observations on degree of polymerization for paper specimens for…
A: Mean is the measure used to determine the average measure of the data set. Standard deviation is…
Q: Department secretary has found the average number of complaints per week over the past few years is…
A: Here, Population mean, µ is 1.4. The sample mean, M(=x-bar) is 3. Sum of squares, ss = 16. Sample…
Q: What type of statistical test are you conducting if h1 states that the parameter is greater than the…
A: Given that, h1 states that the parameter is greater than the value claimed in h0.
Q: Suppose IQ scores were obtained for 20 randomly selected sets of siblings. The 20 pairs of…
A: Correlation is used to understand the strength of association between the two numerical variables.…
Q: ep 1 of 3: Find the second quartile.
A: From the given stem and leaf plot The second quartile is Q2=(2*(n+1)4)th value of the observation…
Q: 3. Dr. Castillejo feels that maximum pulse rate during the run is a good predictor in explaining the…
A: From the output, The regression model is, Oxygen consumption=74.427+0.1327maximum.pulse…
Q: Use the information below to answer Questions #16 - 22. The article "Probabilistic Fatigue…
A: Given: exponential distribution with 9
Q: The following data represent the results from the specific gravity test performed in a soil…
A: This is a grouped frequency data, we can calculate the RMS using the class mark.
Q: As a bonus assignment a former student checked if your professor gave a statisticallysignificant…
A: We have to perform Z test for testing the difference in the proportion.
Q: An inventor has developed a new spray coating that is designed to improve the wear of bicycle tires.…
A:
Q: Define the following terms: A. Estimation B. Estimator C. Estimate And state the methods used in…
A: Given : Terms : A. Estimation B. Estimator C. Estimate
Q: The production data of a wheat farm are: Plant area: 500 ha Mean yield: 1.5 t/ha • Standard…
A:
Q: andres asked if there is a relationship between the quality of sneakers worn by a sample of 20…
A: Given that the sample size is n=20. The correlation coefficient based on sample size is r=0.21.…
Q: Researchers studied the effect of a houseplant fertilizer on carrot sprout growth. They randomly…
A: Statistical hypothesis testing is an important method in inferential statistics. It is used to test…
Q: Ina certain type of metal test specimen, the normal stress on a specimen is known to be functionally…
A: The independent variable is Normal Stress. The dependent variable is Shear Resistance. We have to…

Step by step
Solved in 4 steps with 1 images


- A researcher evaluates a new cholesterol medication by measuring cholesterol levels for a group of patients before they begin taking the medication and after they have been taking the medication for 8 weeks. A second researcher measures quality of life for a group of 40-year-old men who have been married for at least 5 years and a group of 40-year-old men who are still single. Explain why the first researcher is probably not concerned about the validity of the measurement, whereas the second researcher probably is. (Hint: What variable is each researcher measuring and how will it be measured?)An analysis was conducted by the Statistics Consulting Center atVirginia Polytechnic Institute and State University in which acertain treatment was applied to a set of tree stumps. The chemicalGarlon was used the with the purpose of regenerating the roots ofthe stumps. A spray was used with four levels of GarlonPage 23 of 23concentration. After a period of time the height of the shoots wasobserved. Does the concentration of Garlon has a significantimpact on the height of the shoots? Use α = 0.05.The Us food and Drug administration has a limit for mercury content in fish of 1.0ppm (parts per million) while in Canada the limit is 0.5 ppm. Using the variable average mercury in the Florida lakes dataset to test whether there is evidence that average mercury level of fish ( large mouth Bass) in Florida lakes is less than 1.0ppm and whether there is evidence that average mercury level of fish in Florida lakes is less than 0.5ppm. STATE THE NULL AND ALTERNATIVE HYPOTHESES? GIVE THE TEST STATISTICS AND P-VALUE? round the test statistic to two decimal places and the p-value to three decimal places. DOES THIS SAMPLE PROVIDE EVIDENCE THAT THE AVERAGE MERCURY LEVEL OF FISH (LARGE MOUTH BASS) IN FLORIDA LAKES IS LESS THAN 1.0PPM? LESS THAN 0.5 PPM : STATE THE NULL AND ALTERNATIVE HYPOTHESES. GIVE THE TEST STATISTICS AND P-VALUE ? round the test statistic to two decimal places and the p-value to three decimal places. DOES THIS SAMPLE PROVIDE EVIDENCE THAT THE AVERAGE MERCURY…
- Many small restaurants in Portland, Oregon, and other cities across the United States do not take reservations. Owners say that with smaller capacity, no-shows are costly, and they would rather have their staff focused on customer service rather than maintaining a reservation system. However, it is important to be able to give reasonable estimates of waiting time when customers arrive and put their names on the waiting list. The file RestaurantLine contains 10 observations of number of people in line ahead of a customer (independent variable x) and actual waiting time (dependent variable y). The estimated regression equation is: ŷ=7.82+8.84x and MSE=113.9197. Point estimate for customers with 3 people on the waitlist is 34.3 minutes. b. Develop a 95% confidence interval for the mean waiting time for a customer who arrives with three customers already in line (to 2 decimals). c. Develop a 95% prediction interval for Roger and Sherry Davy's waiting time if there are three customers in…It is believed that the mean number of chronic conditions amongst the elderly is 1.75. A physician randomly samples 150 elderly individuals and computes a sample mean of 1.62 Which value is the parameter and which the statistic? A second physician also samples 150 elderly individuals and will compute the sample mean number of chronic conditions? Do you think they will get the same result?Many small restaurants in Portland, Oregon, and other cities across the United States do not take reservations. Owners say that with smaller capacity, no-shows are costly, and they would rather have their staff focused on customer service rather than maintaining a reservation system. However, it is important to be able to give reasonable estimates of waiting time when customers arrive and put their name on the waiting list. The file RestaurantLine contains 10 observations of number of people in line ahead of a customer (independent variable x) and actual waiting time (dependent variable y). The estimated regression equation is: ŷ=4.35+8.81x and MSE=94.4236. Point Estimate for customers who arrive with 3 people on the wait list is 30.8 minutes. a. Develop a 95% confidence interval for the mean waiting time for a customer who arrives with three customers already in line (to 2 decimals). b. Develop a 95% prediction interval for Roger and Sherry Davy's waiting time if there are three…
- Many small restaurants in Portland, Oregon, and other cities across the United States do not take reservations. Owners say that with smaller capacity, no-shows are costly, and they would rather have their staff focused on customer service rather than maintaining a reservation system.† However, it is important to be able to give reasonable estimates of waiting time when customers arrive and put their name on the waiting list. The file RestaurantLine contains 10 observations of number of people in line ahead of a customer (independent variable x) and actual waiting time (in minutes) (dependent variable y). The estimated regression equation is: ŷ = 4.35 + 8.81x and MSE = 94.42. (a) Develop a point estimate (in min) for a customer who arrives with seven people on the wait-list. (Round your answer to two decimal places.) ŷ* = _____min (b) Develop a 95% confidence interval for the mean waiting time (in min) for a customer who arrives with seven customers already in line. (Round…A group of 10-year-old boys were first ascertained in a camp for diabetic boys. They had their weight measured at baseline and again when they returned to camp 1 year later. Each time, a serum sample was obtained from which a determination of hemoglobin A1c (HgbA1c) was made. HgbA1c (also called glycosylated hemoglobin) is routinely used to monitor compliance with taking insulin injections. Usually, the poorer the compliance, the higher the HgbA1c level will be. The hypothesis is that the level HgbA1c is related to weight. The data in Table 11.28 were obtained. 11.92 What test can be performed to assess the relationship between weight and HgbA1c at the initial visit? 11.93 Please perform the test in Problem 11.92, and report a two-tailed p-value. 11.94 Do the results in Problem 11.93 imply a relationship between change in HgbA1c and change in weight for an individual boy? Why or why not?A group of 10-year-old boys were first ascertained in a camp for diabetic boys. They had their weight measured at baseline and again when they returned to camp 1 year later. Each time, a serum sample was obtained from which a determination of hemoglobin A1c (HgbA1c) was made. HgbA1c (also called glycosylated hemoglobin) is routinely used to monitor compliance with taking insulin injections. Usually, the poorer the compliance, the higher the HgbA1c level will be. The hypothesis is that the level HgbA1c is related to weight. The data in Table 11.28 were obtained. 11.95 Compute a rank correlation between change in weight and change in HgbA1c, each over 1 year. Use this measure to directly test the hypothesis that change in weight over 1 year is related to change in HgbA1c. Report a two-tailed p-value, and provide a 95% confidence interval for the underlying rank correlation.
- A group of 10-year-old boys were first ascertained in a camp for diabetic boys. They had their weight measured at baseline and again when they returned to camp 1 year later. Each time, a serum sample was obtained from which a determination of hemoglobin A1c (HgbA1c) was made. HgbA1c (also called glycosylated hemoglobin) is routinely used to monitor compliance with taking insulin injections. Usually, the poorer the compliance, the higher the HgbA1c level will be. The hypothesis is that the level HgbA1c is related to weight. The data in Table 11.28 were obtained.11.92 What test can be performed to assess the relationship between weight and HgbA1c at the initial visit?11.93 Please perform the test in Problem 11.92, and report a two-tailed p-value.11.94 Do the results in Problem 11.93 imply a relationship between change in HgbA1c and change in weight for an individual boy? Why or why not?11.95 Compute a rank correlation between change in weight and change in HgbA1c, each over 1 year. Use…A group of 10-year-old boys were first ascertained in a camp for diabetic boys. They had their weight measured at baseline and again when they returned to camp 1 year later. Each time, a serum sample was obtained from which a determination of hemoglobin A1c (HgbA1c) was made. HgbA1c (also called glycosylated hemoglobin) is routinely used to monitor compliance with taking insulin injections. Usually, the poorer the compliance, the higher the HgbA1c level will be. The hypothesis is that the level HgbA1c is related to weight. The data in Table 11.28 were obtained.11.94 Do the results in Problem 11.93 imply a relationship between change in HgbA1c and change in weight for an individual boy? Why or why not?11.95 Compute a rank correlation between change in weight and change in HgbA1c, each over 1 year. Use this measure to directly test the hypothesis that change in weight over 1 year is related to change in HgbA1c. Report a two-tailed p-value, and provide a 95% confidence interval for the…Several years ago, researchers conducted a study to determine whether the "accepted" value for normal body temperature, 98.6oF, is accurate. They used an oral thermometer to measure the temperatures of a random sample of healthy men and women aged 18 to 40. As is often the case, the researchers did not provide their original data. Allen Shoemaker, from Calvin College, produced a data set with the same properties as the original temperature readings. His data set consists of one oral temperature reading for each of the 130 randomly chosen, healthy 18- to 40-year-olds. A dot plot of Shoemaker's temperature data is shown below. A vertical line at 98.6oF was added for reference. Exploratory data analysis revealed several interesting facts about this data set: The mean temperature was x ¯ = 98.25 o F The standard deviation of the temperature reading was s x = 0.73 o F 62.3% of the temperature readings were less than 98.6oF. If "normal" body temperature really is 98.6oF, we would expect…