Are these data good evidence that on average the E. coli levels in these swimming areas were safe? To investigate water quality, in early September 2016, the Ohio Department of Health took water samples at 24 beaches on Lake Erie in Erie County. Those samples were tested for fecal coliform, which is the E.coli bacteria found in human and animal feces. An unsafe level of fecal coliform means there is a higher chance that disease-causing bacteria are present and more risk that a swimmer will become ill if she or he should accidentally ingest some of the water. Ohio considers it unsafe for swimming if a 100-milliliter sample (about 3.4 ounces) of water contains more than 400 coliform O The data gives us no conclusive evidence one way or the other. There is not good evidence to conclude that swimming areas in Erie County have mean E. coli counts less than 400 bacteria per 100 ml. O There is good evidence to conclude that swimming areas in Erie County have mean E. coli counts less than 400 bacteria per 100mL. bacteria. The E. coli levels found by the laboratories are shown in the table. 18.7 579.4 1986.3 517.2 98.7 45.7 201.4 (b) Use the software of your choice to make a graph of the data. The distribution is very skewed. Another method that gives P-values without assuming any specific shape for the distribution gives a P-value of 0.0043 to answer if the given data shows average E.coli levels were safe in the swimming areas. 124.6 19.9 83.6 365.4 307.6 285.1 152.9 18.7 151.5 365.4 238.2 209.8 290.9 137.6 1046.2 127.4 224.7 How does the one-sample i test compare with this? O Both methods give similar P-values. O The one-sample i test gives a significantly lower P-value. Take these water samples to be an SRS of the water in all swimming areas in Erie County. Let µ represent the mean E. coli counts for all possible 100-mL samples taken from all swimming areas in Erie County. We test Họ : H = 400 versus Ha : µ < 400 because the researchers are interested in whether the average E. coli levels in these The one-sample test gives a significantly higher P-value. areas are safe. (a) Find x, s, and the t statistic. (Enter your answers rounded to three decimal places) Should the r procedures be used with these data? O Due to extreme skew and the presence of outliers, I procedures should not be used here. Due to symmetry and the absence of outliers, procedures should be used here. O Due to symmetry and the absence of outliers, 1 procedures should not be used here. What does the P-value from the method that does not assume any specific shape for the distribution indicate? O The method that does not assume a specific shape for the distribution provides very strong evidence that these swimming areas are safe on average. O The method that does not assume a specific shape for the distribution provides very little evidence that these swimming areas are safe on average. O The method that does not assume a specific shape for the distribution provides very strong evidence that these Find the P-value. (Enter your answer rounded to four decimal places.) swimming areas are not safe on average. P- value =
Are these data good evidence that on average the E. coli levels in these swimming areas were safe? To investigate water quality, in early September 2016, the Ohio Department of Health took water samples at 24 beaches on Lake Erie in Erie County. Those samples were tested for fecal coliform, which is the E.coli bacteria found in human and animal feces. An unsafe level of fecal coliform means there is a higher chance that disease-causing bacteria are present and more risk that a swimmer will become ill if she or he should accidentally ingest some of the water. Ohio considers it unsafe for swimming if a 100-milliliter sample (about 3.4 ounces) of water contains more than 400 coliform O The data gives us no conclusive evidence one way or the other. There is not good evidence to conclude that swimming areas in Erie County have mean E. coli counts less than 400 bacteria per 100 ml. O There is good evidence to conclude that swimming areas in Erie County have mean E. coli counts less than 400 bacteria per 100mL. bacteria. The E. coli levels found by the laboratories are shown in the table. 18.7 579.4 1986.3 517.2 98.7 45.7 201.4 (b) Use the software of your choice to make a graph of the data. The distribution is very skewed. Another method that gives P-values without assuming any specific shape for the distribution gives a P-value of 0.0043 to answer if the given data shows average E.coli levels were safe in the swimming areas. 124.6 19.9 83.6 365.4 307.6 285.1 152.9 18.7 151.5 365.4 238.2 209.8 290.9 137.6 1046.2 127.4 224.7 How does the one-sample i test compare with this? O Both methods give similar P-values. O The one-sample i test gives a significantly lower P-value. Take these water samples to be an SRS of the water in all swimming areas in Erie County. Let µ represent the mean E. coli counts for all possible 100-mL samples taken from all swimming areas in Erie County. We test Họ : H = 400 versus Ha : µ < 400 because the researchers are interested in whether the average E. coli levels in these The one-sample test gives a significantly higher P-value. areas are safe. (a) Find x, s, and the t statistic. (Enter your answers rounded to three decimal places) Should the r procedures be used with these data? O Due to extreme skew and the presence of outliers, I procedures should not be used here. Due to symmetry and the absence of outliers, procedures should be used here. O Due to symmetry and the absence of outliers, 1 procedures should not be used here. What does the P-value from the method that does not assume any specific shape for the distribution indicate? O The method that does not assume a specific shape for the distribution provides very strong evidence that these swimming areas are safe on average. O The method that does not assume a specific shape for the distribution provides very little evidence that these swimming areas are safe on average. O The method that does not assume a specific shape for the distribution provides very strong evidence that these Find the P-value. (Enter your answer rounded to four decimal places.) swimming areas are not safe on average. P- value =

MATLAB: An Introduction with Applications
6th Edition
ISBN:9781119256830
Author:Amos Gilat
Publisher:Amos Gilat
Chapter1: Starting With Matlab
Section: Chapter Questions
Problem 1P

Related questions
Topic Video
Question
Help please!!
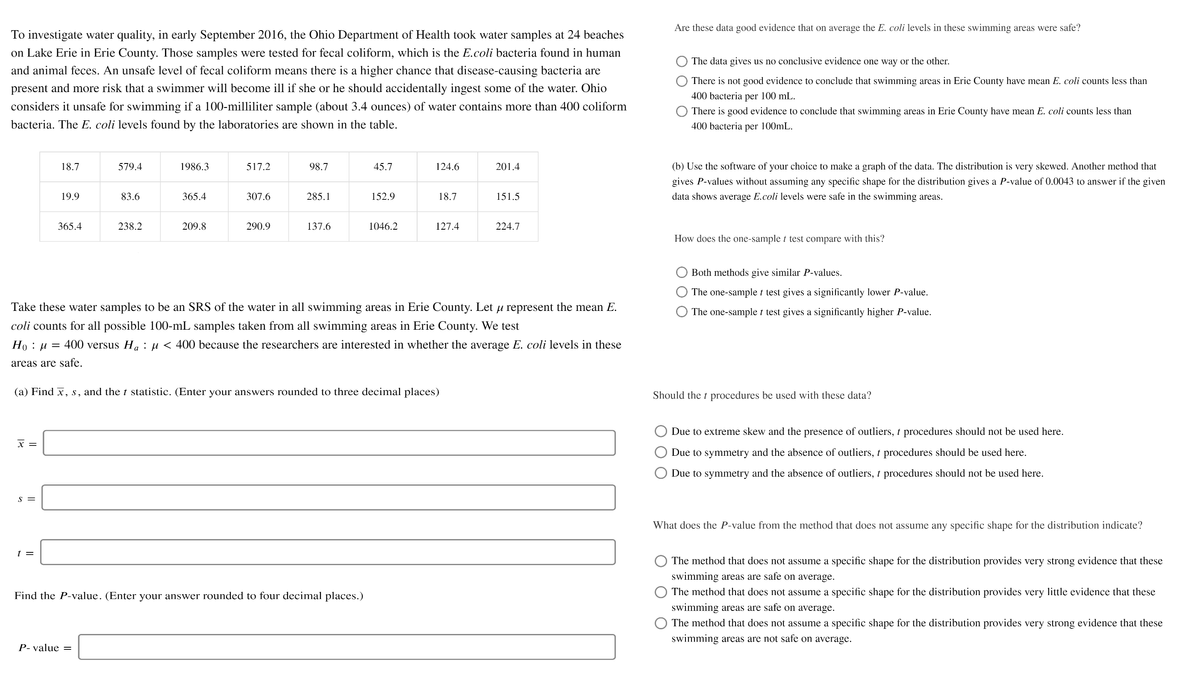
Transcribed Image Text:Are these data good evidence that on average the E. coli levels in these swimming areas were safe?
To investigate water quality, in early September 2016, the Ohio Department of Health took water samples at 24 beaches
on Lake Erie in Erie County. Those samples were tested for fecal coliform, which is the E.coli bacteria found in human
The data gives us no conclusive evidence one way or the other.
and animal feces. An unsafe level of fecal coliform means there is a higher chance that disease-causing bacteria are
There is not good evidence to conclude that swimming areas in Erie County have mean E. coli counts less than
present and more risk that a swimmer will become ill if she or he should accidentally ingest some of the water. Ohio
400 bacteria per 100 mL.
considers it unsafe for swimming if a 100-milliliter sample (about 3.4 ounces) of water contains more than 400 coliform
There is good evidence to conclude that swimming areas in Erie County have mean E. coli counts less than
bacteria. The E. coli levels found by the laboratories are shown in the table.
400 bacteria per 100mL.
18.7
579.4
1986.3
517.2
98.7
45.7
124.6
201.4
(b) Use the software of your choice to make a graph of the data. The distribution is very skewed. Another method that
gives P-values without assuming any specific shape for the distribution gives a P-value of 0.0043 to answer if the given
19.9
83.6
365.4
307.6
285.1
152.9
18.7
151.5
data shows average E.coli levels were safe in the swimming areas.
365.4
238.2
209.8
290.9
137.6
1046.2
127.4
224.7
How does the one-sample t test compare with this?
Both methods give similar P-values.
The one-sample t test gives a significantly lower P-value.
Take these water samples to be an SRS of the water in all swimming areas in Erie County. Let u represent the mean E.
The one-sample t test gives a significantly higher P-value.
coli counts for all possible 100-mL samples taken from all swimming areas in Erie County. We test
Ho : µ = 400 versus H. : µ < 400 because the researchers are interested in whether the average E. coli levels in these
areas are safe.
(a) Find x, s, and the t statistic. (Enter your answers rounded to three decimal places)
Should the t procedures be used with these data?
Due to extreme skew and the presence of outliers, t procedures should not be used here.
x =
Due to symmetry and the absence of outliers, t procedures should be used here.
Due to symmetry and the absence of outliers, t procedures should not be used here.
S =
What does the P-value from the method that does not assume any specific shape for the distribution indicate?
t =
The method that does not assume a specific shape for the distribution provides very strong evidence that these
swimming areas are safe on average.
Find the P-value. (Enter your answer rounded to four decimal places.)
The method that does not assume a specific shape for the distribution provides very little evidence that these
swimming areas are safe on average.
The method that does not assume a specific shape for the distribution provides very strong evidence that these
swimming areas are not safe on average.
P- value =
Expert Solution
This question has been solved!
Explore an expertly crafted, step-by-step solution for a thorough understanding of key concepts.

This is a popular solution!

Trending now
This is a popular solution!

Step by step
Solved in 3 steps

Knowledge Booster


Learn more about
Need a deep-dive on the concept behind this application? Look no further. Learn more about this topic, statistics and related others by exploring similar questions and additional content below.Recommended textbooks for you
MATLAB: An Introduction with Applications
Statistics
ISBN:
9781119256830
Author:
Amos Gilat
Publisher:
John Wiley & Sons Inc

Probability and Statistics for Engineering and th…
Statistics
ISBN:
9781305251809
Author:
Jay L. Devore
Publisher:
Cengage Learning

Statistics for The Behavioral Sciences (MindTap C…
Statistics
ISBN:
9781305504912
Author:
Frederick J Gravetter, Larry B. Wallnau
Publisher:
Cengage Learning
MATLAB: An Introduction with Applications
Statistics
ISBN:
9781119256830
Author:
Amos Gilat
Publisher:
John Wiley & Sons Inc
Probability and Statistics for Engineering and th…
Statistics
ISBN:
9781305251809
Author:
Jay L. Devore
Publisher:
Cengage Learning
Statistics for The Behavioral Sciences (MindTap C…
Statistics
ISBN:
9781305504912
Author:
Frederick J Gravetter, Larry B. Wallnau
Publisher:
Cengage Learning

Elementary Statistics: Picturing the World (7th E…
Statistics
ISBN:
9780134683416
Author:
Ron Larson, Betsy Farber
Publisher:
PEARSON

The Basic Practice of Statistics
Statistics
ISBN:
9781319042578
Author:
David S. Moore, William I. Notz, Michael A. Fligner
Publisher:
W. H. Freeman

Introduction to the Practice of Statistics
Statistics
ISBN:
9781319013387
Author:
David S. Moore, George P. McCabe, Bruce A. Craig
Publisher:
W. H. Freeman