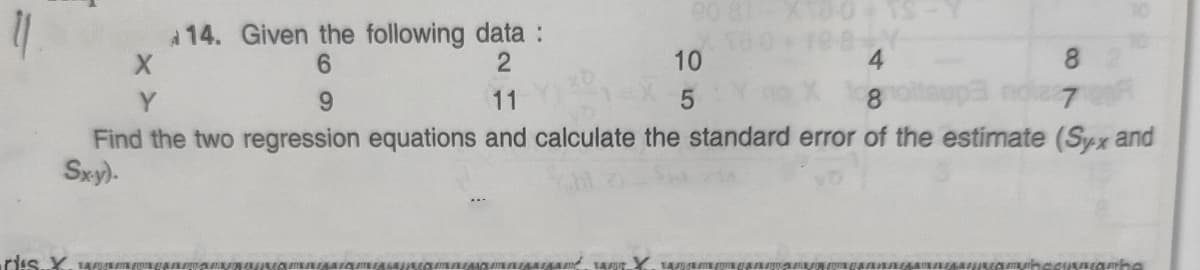
14. Given the following data : 6. 2 10 Y 9. 11 8. Find the two regression equations and calculate the standard error of the estimate (Syx and Sxy).


Q: Given are five observations for two variables, and . 3 13 7 22 20 53 40 50 16 21 b. What does…
A: Hi! Thank you for the question, as per the honor code, we are allowed to answer three sub-parts at a…
Q: The following X and Y scores produce SSx = 2 and SP = 8. What is regression equation for predicting…
A: From the SSX=2 and SP=8. X Y 1 2 2 3 3 10 Average 2 5
Q: c. Does Vanguard's advertising expenditure have a statistically significant effect on the sales of…
A: c. The pvalue of A i.e. vanguard's expenditure on advertisement is 0.0128 which is less than 0.05…
Q: 233 4SS G6 10 11 12 15 19 20 18 Pind the regression ne for the data. Assumeis the dificuty level and…
A: We have given that, X:- 2, 3, 3, 4, 5, 6, 6, 6 Y:- 10, 11, 12, 9, 15, 19, 20, 18 Then, We will find…
Q: 5. Find regression line to the following data. 4 5 3.2 5.6 9.3 14. 21.9 Y 24 21 2.1 Also find the…
A:
Q: 14. Consider the following regression equation: Y = 30 - 9X. If SSE = 600 and SS Total = 1,200, then…
A: The square of correlation coefficient is computed by r2=1-SSESST, where SSE is the error sum of…
Q: 2:4: A/ Find the estimated regression line equation for the following data that represents income in…
A: Here AS PER POLICY I SHOULD HAVE TO CALCULATE FIRST MAIN QUESTION ONLY EVEN THOUGH I HAVE CALCULATED…
Q: The following data on price ($) and the overall score for 6 stereo headphones that were tested by…
A: The data shows the price and the overall score for 6 stereo headphones that were tested by consumer.
Q: 4. Y = 0.43X + 1.1; X = 0.97 5. Y = X +:X = 6. Assume that the height of fathers (X) and the height…
A:
Q: Consider the following data for two variables, x and y. 9 32 18 15 26 y 10 19 20 17 21 (a) Develop…
A: Solution : Given : α = 0.05, n= 5 X 9 32 18 15 26 Y 10 19 20 17 21 a) Estimated regression…
Q: Isider the following estimated regression In Y, = 2.57 + 0.212 InKt + 0.343 InLt + 0.030 InWt (2.90)…
A: Q
Q: A set of n=10 pairs of X and Y scores has SSx=10, SSy=60, and SP=20. What is the slope of the…
A: Given:
Q: For the following data 2 5 10 12 15 14 15 (i) Find line of regression of Y on X (ii) Estimate Y for…
A:
Q: 1. Use the computer output to write the estimated regression equation for predicting birth weight…
A: Since you have posted a question with multiple sub-parts, we will solve the first three subparts for…
Q: Given the following data n=5. Σ x= 15, Σ (X - Χ:-10, Σ (r - )' = 25. Σ (X - ΣΧΥ-7- 3 Compute the…
A: Given: n=5, ∑x=15, ∑y=20, ∑x-x2=10, ∑y-y2=26 and ∑x-xy-y=13. Then,x=∑xn=155=3y=∑yn=205=4
Q: Given are five observations for two variables, x and y. xi 1 2 3 4 5 yi 4 7 4 11 14 Develop…
A: Given are five observations for two variables, x and y. xi 1 2 3 4 5 yi 4 7 4 11 14
Q: 14. Given the following data : 2 10 4 8 Y 9. 11 8 Find the two regression equations and calculate…
A:
Q: 15. The following calculations have been made for the price of 12 stocks (X) on BSE on a certain day…
A: Since you have asked multiple question, we will solve the first question for you. If you want any…
Q: Calculate regression equations from the following infcrma- tions: Values of x = 4 6 10 12 Values of…
A:
Q: Consider the following data for two variables, x and y. 9 32 18 15 26 y 10 21 22 17 23 (a) Develop…
A: Given data, y x x2 10 9 81 21 32 1024 22 18 324 17 15 225…
Q: A local retail store compared their monthly sales of Umbrellas with the amount of rainfall that…
A: Solution: Given information: Let x = Rainfall (in) and y= Number of umbrellas x= 4.64y= 34.2Sx=…
Q: 2. Calculate the two line of regression for the following data. X: 1 3 4 5 Y. 3 9 12 15 S Scanned…
A:
Q: Consider the following estimated regression equation: y' = 5.2 - 10.3x If (x = 10, y = -100) was one…
A:
Q: Determine the regression equation for the following questions using the existing methods 10 15 22,5…
A: Given data is x 10 15 22.5 33.7 50.65 75.9 y 0.3 0.675 1.519 3.417 7.689 17.3
Q: This data was used to develop an estimated regression equation, ý = 1,405.33 + 7.44x, relating…
A: The null and alternative hypothesis is given below:
Q: With the help of data given in the following table calculate regression line Y'. ΣΧ ΣΥ ΣΧΥ Σχ2 15 25…
A:
Q: A sample of X and Y scores is taken, and a regression line is used to predict Y from X. If SSY' =…
A: Given information- We have given sample of X and Y scores. We have to predict Y from X using…
Q: Find the regression coefficient of y on x from the following regression equations. 5x 22 +y 64 x 24+…
A:
Q: A shoe store developed the following estimated regression equation relating sales to inventory…
A:
Q: 24. Use the given data to find the equation of the regression line. Round the final values to…
A: X Y (Xi-Xbar) (Yi-Ybar) (Yi-Ybar)2 (Xi-Xbar)(Yi-Ybar) 034512 826912 -4.8-1.8-0.80.27.2…
Q: From the data given below find the two regression equations and calculate the Standard Errors of the…
A:
Q: The following data on price ($) and the overall score for 6 stereo headphones that were tested by…
A: The independent variable is Score. The dependent variable is Price. This is simple linear regression…
Q: For 10 observations on price (p) and supply (S) the following data were obtained (in appropriate…
A:
Q: Given are five observations for two variables, x and y. xi 1 2 3 4 5 yi 4 6 6 11 13 Develop the…
A: Given: n=5 The formulas of b0 and…
Q: A factory estimated the relationship between the number of labor hours (Independent) and the number…
A:
Q: 4) Usethe given data to find the equation of the regression line. Round the final valuesto three…
A: ----------------------------------------------------------------------------------------------------…
Q: Consider the following regression analysis between sales (Y in $1,000) and social media advertising…
A: Given Data: Regression equation: Ŷ = 55,000 + 7X where, Y is the dependent variable X is the…
Q: Given the following data n= 5, Σ x = 15, Σ ( -X)10. Σ (-7- 26, Σ ( ΧYY-= 13 Compute the…
A: Given n=5, ∑x=15, ∑y=20, ∑X-X¯2=10, ∑Y-Y¯2=26, ∑X-X¯Y-Y¯=13
Q: 3.Compute forecast values for t=10 and t=21 based on the constructed regression function using the…
A: Excel Procedure: Enter t and Amount in Excel>Data>Data Analysis> ‘Regression’>Select…
Q: Given the following table of values: y 1 10 2 8 5 4 Which of the following would be the correct…
A: By regression we mean prediction or estimation of the average value of one variable for specified…
Q: Y X2 X3 140 4 8 260 6 12 350 7 10 470 10 5 590 13 10
A: Use the following formulae, to find the multiple linear regression equation with two independent…
Q: a. Determine the correlation coefficient between the percentage of teenagers who have used Drug 1…
A: Please find the solution Given data: x 23 18 39 4 36 19 23 7 8 54 34 y 5 4 21 0 17 8 15 2 2…
Q: "given a simple regression with slope b=3, s (sub y)=8, and s (sub x)= 2, and n=30. Find the…
A:
Q: Given are five observations for two variables, and y. Excel File: data14-25.xlsx xi Yi 0.9726 2 7…
A: The standard error is the error occur in the observation. The standard error of estimate is…
Q: Given are five observations for two variables, and . 1 2 3 4 5 3 7 7 10 14 d.…
A:
Q: Given are five observations collected in a regression study on two variables. xi 2 6 9 13 20…
A: Solution: b. The regression equation is obtained by using excel. Procedure: Enter the data in…
Q: Assume there is a positive linear correlation between the variable R (Return rate in percent of a…
A:
Q: Given are five observations for two variables, x and y. xi 1 2 3 4 5 yi 4 5 5 10 14 Which of the…
A: Use EXCEL to construct the scatter plot. EXCEL procedure: Go to EXCEL Go to Insert menu…
Q: A researcher conducted a number of descriptive statistics for two variables X and Y. They were as…
A: It is given that the, SP = -20; SSx = 4; My = 7; Mx = 3 From the above information, we have to find…

Step by step
Solved in 2 steps with 2 images

- Olympic Pole Vault The graph in Figure 7 indicates that in recent years the winning Olympic men’s pole vault height has fallen below the value predicted by the regression line in Example 2. This might have occurred because when the pole vault was a new event there was much room for improvement in vaulters’ performances, whereas now even the best training can produce only incremental advances. Let’s see whether concentrating on more recent results gives a better predictor of future records. (a) Use the data in Table 2 (page 176) to complete the table of winning pole vault heights shown in the margin. (Note that we are using x=0 to correspond to the year 1972, where this restricted data set begins.) (b) Find the regression line for the data in part ‚(a). (c) Plot the data and the regression line on the same axes. Does the regression line seem to provide a good model for the data? (d) What does the regression line predict as the winning pole vault height for the 2012 Olympics? Compare this predicted value to the actual 2012 winning height of 5.97 m, as described on page 177. Has this new regression line provided a better prediction than the line in Example 2?If a sample of 25 pairs of data yields a correlation coefficient, r, of 0.390 and the scatterplot displays a linear trend, can you use the regression equation to make predictions, assuming your x-values are within the domain of the data set? Choose your answer from the multiple choice answers below A.) Yes, because rcrit = 0.396 and the regression coefficient, r, is less than this value. B.) Yes, because rcrit = 0.381 and the regression coefficient, r, is greater than this value. C.) No, because rcrit = 0.381 and the regression coefficient, r, is greater than this value. D.) No, because rcrit = 0.396 and the regression coefficient, r, is less than this value.Consider the following data: x¯ = 20, sx = 2, y¯ = −5, sy = 4, and b1 = 0.40. Which of the following is the sample regression equation?
- Suppose that R2= 1 for a data set. What can you say abota. SSE? b. SSR? c. the utility of the sample multiple linear regression equation for making predictions?Suppose that R2 = 1 for a data set. What can you say abouta. SSE?b. SSR?c. the utility of the sample multiple linear regression equation for making predictions?Consider the following sample regression equation yˆ = 150 − 20x, where y is the demand for Product A (in 1,000s) and x is the price of the product (in $). The slope coefficient indicates that if _____
- If the standard error of the estimate for a regression model fitted to a large number of paired observations is 1.75, approximately 95% of the residuals would lie within ______. −3.50 and +3.50 −1.75 and +1.75 −0.95 and +0.95 −0.68 and +0.68 −0.97 and +0.97Given below are results from the regression analysis where the dependent variable is the number of weeks a worker is unemployed due to a layoff (Unemploy) and the independent variables are the age of the worker (Age), the number of years of education received (Edu), the number of years at the previous job (Job Yr), a dummy variable for marital status (Married: 1=married, 0=otherwise), a dummy variable for head of household (Head: 1=yes, 0=no) and a dummy variable for management position (Manager: 1=yes, 0=no). We shall call this Model 1. The coefficient of partial determination (R2Yj.(All variables except j)) of each of the six predictors are, respectively, 0.2807, 0.0386, 0.0317, 0.0141, 0.0958, and 0.1201. Model 2 is the regression analysis where the dependent variable is Unemploy and the independent variables are Age and Manager. The results of the regression analysis are given. Refer to model 1. Which of the following is the correct null hypothesis to test…Consider the following hypothetical regression, with FAIL? as a dummy variable for if a business failed in its first year (1=failed, 0=didn’t fail); LOAN is how much money, in thousands of dollars, the business got as a loan when it started; GIG? is a dummy variable for if there was a gig economy job available, such as driving for Lyft (1=available, 0=not available), and COMP is the number of existing competitors the business faced when it started. All variables are statistically significant. FAIL? = 0.63 – 0.01*LOAN – 0.08*GIG? + 0.05*COMP Answer the following: Determine the predicted value of FAIL? if the business had a $30,000 loan, there was no gig economy, and four competitors. In everyday language, what does the estimated value found in A mean? If a business gets an additional six thousand dollars in loans, how would FAIL? change? Give the “punchline” interpretation of the COMP variable: “For every additional competitor…”
- For each of the following, explain what is wrong and why. a)In simple linear regression, the null hypothesis of the ANOVA F test is H0: β0 = 0. b)In an ANOVA table, the mean squares add. In other words, MST = MSM + MSE. c)The smaller the P-value for the ANOVA F test, the greater the explanatory power of the model. d)The total degrees of freedom in an ANOVA table are equal to the number of observations n.When is a variable in a regression statistically significant? 1 When p is more than alpha. 2 When p is more than R2. 3 When p is less than alpha. 4 When p is less than R2. 5 When p is less than the coefficient.The following sample observations were randomly selected X Y 4 4 5 6 3 5 6 7 10 7 What is the y-intercept of the regression equation?


