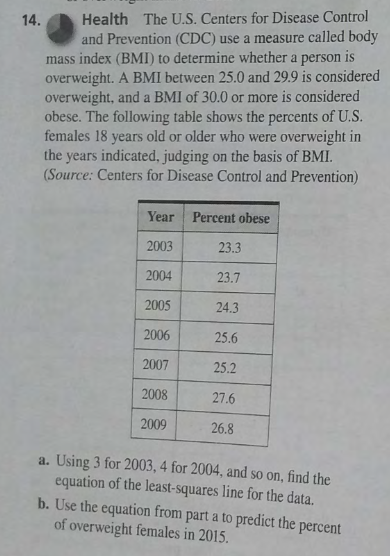
14. Health The U.S. Centers for Disease Control and Prevention (CDC) use a measure called body is mass index (BMI) to determine whether a person overweight. A BMI between 25.0 and 29.9 is considered overweight, and a BMI of 30.0 or more is considered obese. The following table shows the percents of U.S. females 18 years old or older who were overweight in the years indicated, judging on the basis of BMI. (Source: Centers for Disease Control and Prevention) Year Percent obese 2003 23.3 2004 23.7 2005 24.3 2006 25.6 2007 25.2 2008 27.6 2009 26.8 a. Using 3 for 2003, 4 for 2004, and so on, find the equation of the least-squares line for the data. b. Use the equation from part a to predict the percent of overweight females in 2015.
14. Health The U.S. Centers for Disease Control and Prevention (CDC) use a measure called body is mass index (BMI) to determine whether a person overweight. A BMI between 25.0 and 29.9 is considered overweight, and a BMI of 30.0 or more is considered obese. The following table shows the percents of U.S. females 18 years old or older who were overweight in the years indicated, judging on the basis of BMI. (Source: Centers for Disease Control and Prevention) Year Percent obese 2003 23.3 2004 23.7 2005 24.3 2006 25.6 2007 25.2 2008 27.6 2009 26.8 a. Using 3 for 2003, 4 for 2004, and so on, find the equation of the least-squares line for the data. b. Use the equation from part a to predict the percent of overweight females in 2015.

Glencoe Algebra 1, Student Edition, 9780079039897, 0079039898, 2018
18th Edition
ISBN:9780079039897
Author:Carter
Publisher:Carter
Chapter10: Statistics
Section10.6: Summarizing Categorical Data
Problem 42PFA

Related questions
Topic Video
Question
Transcribed Image Text:Health The U.S. Centers for Disease Control
and Prevention (CDC) use a measure called body
14.
mass index (BMI) to determine whether a person is
overweight. A BMI between 25.0 and 29.9 is considered
overweight, and a BMI of 30.0 or more is considered
obese. The following table shows the percents of U.S.
females 18 years old or older who were overweight in
the years indicated, judging on the basis of BMI.
(Source: Centers for Disease Control and Prevention)
Year Percent obese
2003
23.3
2004
23.7
2005
24.3
2006
25.6
2007
25.2
2008
27.6
2009
26.8
a. Using 3 for 2003, 4 for 2004, and so on, find the
equation of the least-squares line for the data.
b. Use the equation from part a to predict the percent
of overweight females in 2015.
Expert Solution
This question has been solved!
Explore an expertly crafted, step-by-step solution for a thorough understanding of key concepts.

This is a popular solution!

Trending now
This is a popular solution!

Step by step
Solved in 2 steps with 1 images

Knowledge Booster


Learn more about
Need a deep-dive on the concept behind this application? Look no further. Learn more about this topic, statistics and related others by exploring similar questions and additional content below.Recommended textbooks for you
Glencoe Algebra 1, Student Edition, 9780079039897…
Algebra
ISBN:
9780079039897
Author:
Carter
Publisher:
McGraw Hill

Big Ideas Math A Bridge To Success Algebra 1: Stu…
Algebra
ISBN:
9781680331141
Author:
HOUGHTON MIFFLIN HARCOURT
Publisher:
Houghton Mifflin Harcourt

Holt Mcdougal Larson Pre-algebra: Student Edition…
Algebra
ISBN:
9780547587776
Author:
HOLT MCDOUGAL
Publisher:
HOLT MCDOUGAL
Glencoe Algebra 1, Student Edition, 9780079039897…
Algebra
ISBN:
9780079039897
Author:
Carter
Publisher:
McGraw Hill
Big Ideas Math A Bridge To Success Algebra 1: Stu…
Algebra
ISBN:
9781680331141
Author:
HOUGHTON MIFFLIN HARCOURT
Publisher:
Houghton Mifflin Harcourt
Holt Mcdougal Larson Pre-algebra: Student Edition…
Algebra
ISBN:
9780547587776
Author:
HOLT MCDOUGAL
Publisher:
HOLT MCDOUGAL