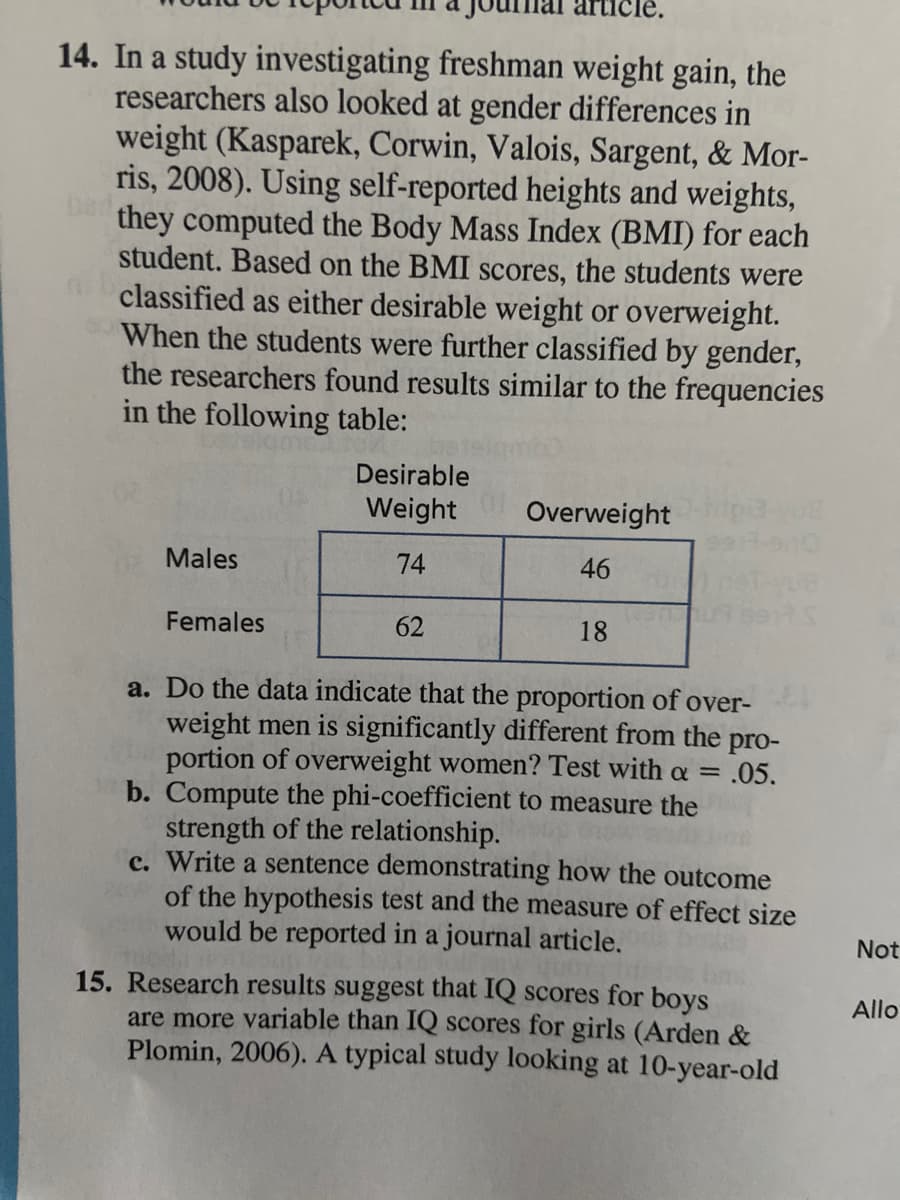
14. In a study investigating freshman weight gain, the researchers also looked at gender differences in weight (Kasparek, Corwin, Valois, Sargent, & Mor- ris, 2008). Using self-reported heights and weights, Ded they computed the Body Mass Index (BMI) for each student. Based on the BMI scores, the students were classified as either desirable weight or overweight. When the students were further classified by gender, the researchers found results similar to the frequencies in the following table: Desirable Weight Overweight Males 74 46 Females 62 18 a. Do the data indicate that the proportion of over- weight men is significantly different from the pro- portion of overweight women? Test with a = b. Compute the phi-coefficient to measure the strength of the relationship. c. Write a sentence demonstrating how the outcome of the hypothesis test and the measure of effect size would be reported in a journal article. .05. 15. Research results suggest that IQ scores for boys are more variable than IQ scores for girls (Arden & Plomin, 2006). A typical study looking at 10-year-old
14. In a study investigating freshman weight gain, the researchers also looked at gender differences in weight (Kasparek, Corwin, Valois, Sargent, & Mor- ris, 2008). Using self-reported heights and weights, Ded they computed the Body Mass Index (BMI) for each student. Based on the BMI scores, the students were classified as either desirable weight or overweight. When the students were further classified by gender, the researchers found results similar to the frequencies in the following table: Desirable Weight Overweight Males 74 46 Females 62 18 a. Do the data indicate that the proportion of over- weight men is significantly different from the pro- portion of overweight women? Test with a = b. Compute the phi-coefficient to measure the strength of the relationship. c. Write a sentence demonstrating how the outcome of the hypothesis test and the measure of effect size would be reported in a journal article. .05. 15. Research results suggest that IQ scores for boys are more variable than IQ scores for girls (Arden & Plomin, 2006). A typical study looking at 10-year-old

Functions and Change: A Modeling Approach to College Algebra (MindTap Course List)
6th Edition
ISBN:9781337111348
Author:Bruce Crauder, Benny Evans, Alan Noell
Publisher:Bruce Crauder, Benny Evans, Alan Noell
Chapter5: A Survey Of Other Common Functions
Section5.3: Modeling Data With Power Functions
Problem 6E: Urban Travel Times Population of cities and driving times are related, as shown in the accompanying...

Related questions
Question
Question #14 part A,B & C.
Transcribed Image Text:cle.
14. In a study investigating freshman weight gain, the
researchers also looked at gender differences in
weight (Kasparek, Corwin, Valois, Sargent, & Mor-
ris, 2008). Using self-reported heights and weights,
Ded
they computed the Body Mass Index (BMI) for each
student. Based on the BMI scores, the students were
classified as either desirable weight or overweight.
When the students were further classified by gender,
the researchers found results similar to the frequencies
in the following table:
Desirable
Weight
Overweight
Males
74
46
Females
62
18
a. Do the data indicate that the proportion of over-
weight men is significantly different from the pro-
portion of overweight women? Test with a =
b. Compute the phi-coefficient to measure the
strength of the relationship.
c. Write a sentence demonstrating how the outcome
of the hypothesis test and the measure of effect size
would be reported in a journal article.
= .05.
Not
15. Research results suggest that IQ scores for boys
are more variable than IQ scores for girls (Arden &
Plomin, 2006). A typical study looking at 10-year-old
Allo
Expert Solution
This question has been solved!
Explore an expertly crafted, step-by-step solution for a thorough understanding of key concepts.

This is a popular solution!

Trending now
This is a popular solution!

Step by step
Solved in 5 steps with 5 images

Recommended textbooks for you
Functions and Change: A Modeling Approach to Coll…
Algebra
ISBN:
9781337111348
Author:
Bruce Crauder, Benny Evans, Alan Noell
Publisher:
Cengage Learning

Glencoe Algebra 1, Student Edition, 9780079039897…
Algebra
ISBN:
9780079039897
Author:
Carter
Publisher:
McGraw Hill
Functions and Change: A Modeling Approach to Coll…
Algebra
ISBN:
9781337111348
Author:
Bruce Crauder, Benny Evans, Alan Noell
Publisher:
Cengage Learning
Glencoe Algebra 1, Student Edition, 9780079039897…
Algebra
ISBN:
9780079039897
Author:
Carter
Publisher:
McGraw Hill