16 12 10 41 5- 40 50 60 70 80 90 40 50 60 70 80 90 40 50 60 70 80 90 Class 1 Class 2 Class 3 80 70 60 50 40 30- C Three statistics classes (50 students each) took the same test. Shown below are histograms of the scores for the classes. Match each class with the corresponding boxplot. Class 2 is Boxplot 1. A Class 3 is Boxplot 2. В --- - 3. C sauepnas 3o # $auepnas 70 # B. $2uepnas 10 $
16 12 10 41 5- 40 50 60 70 80 90 40 50 60 70 80 90 40 50 60 70 80 90 Class 1 Class 2 Class 3 80 70 60 50 40 30- C Three statistics classes (50 students each) took the same test. Shown below are histograms of the scores for the classes. Match each class with the corresponding boxplot. Class 2 is Boxplot 1. A Class 3 is Boxplot 2. В --- - 3. C sauepnas 3o # $auepnas 70 # B. $2uepnas 10 $

Glencoe Algebra 1, Student Edition, 9780079039897, 0079039898, 2018
18th Edition
ISBN:9780079039897
Author:Carter
Publisher:Carter
Chapter10: Statistics
Section10.6: Summarizing Categorical Data
Problem 4CGP

Related questions
Question
Please see below. I need this asap please and thank you.
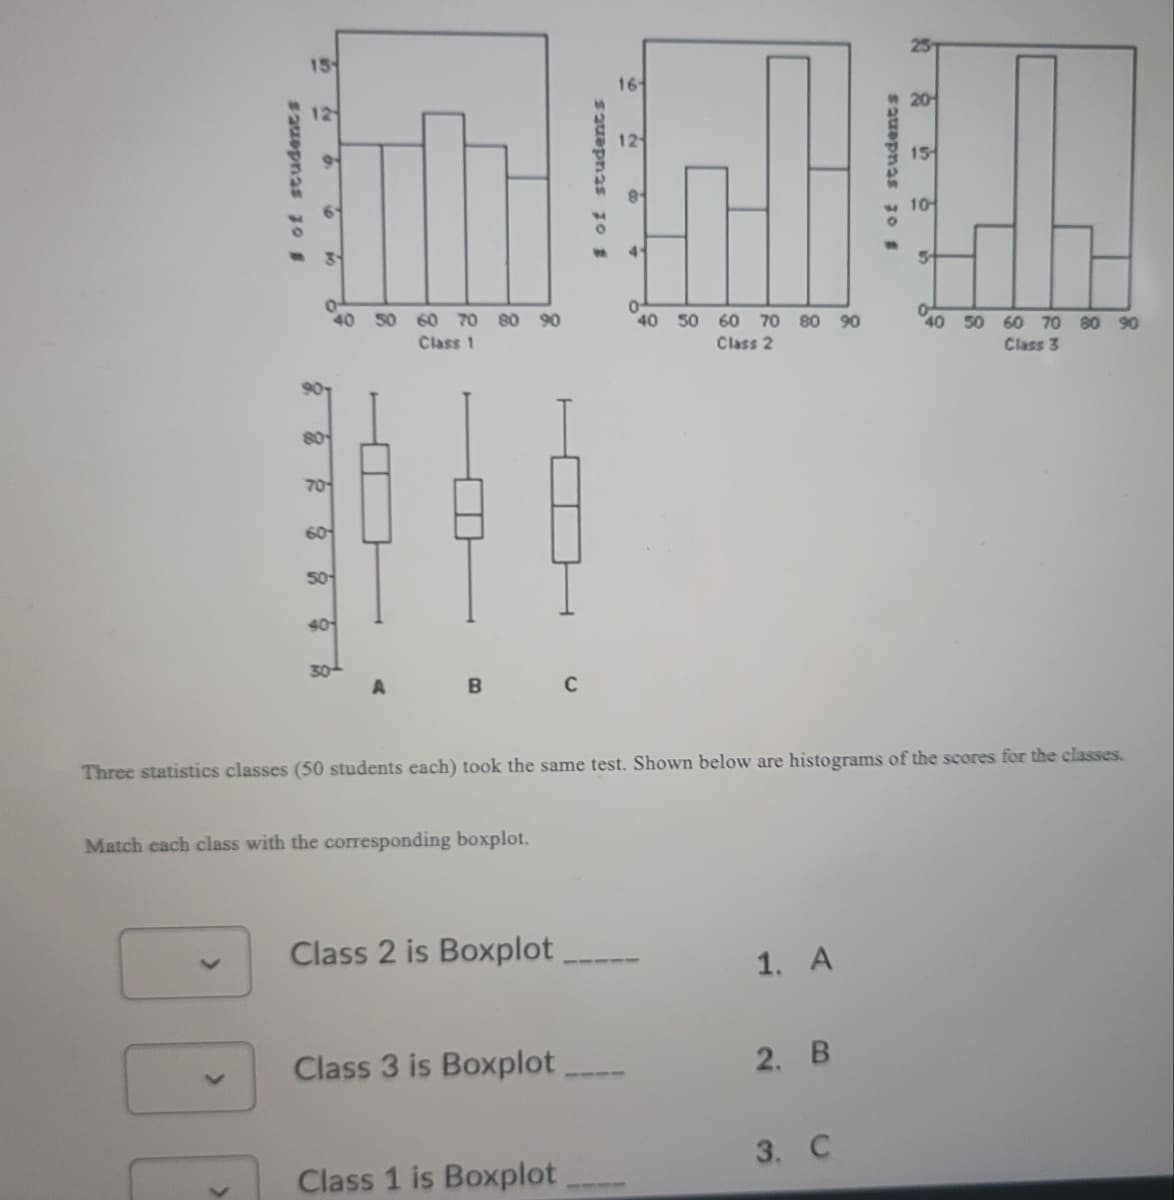
Transcribed Image Text:16
12
10
41
40 50 60 70
80 90
40
50 60 70 80 90
40 50 60 70 80 90
Class 1
Class 2
Class 3
80
70
60
50
40
30
B
C
Three statistics classes (50 students each) took the same test. Shown below are histograms of the scores for the classes.
Match each class with the corresponding boxplot.
Class 2 is Boxplot
1. A
Class 3 is Boxplot
2. B
3. C
Class 1 is Boxplot
sauepnas 3o #
# of students
$2uepnas 10 #
Expert Solution
This question has been solved!
Explore an expertly crafted, step-by-step solution for a thorough understanding of key concepts.

This is a popular solution!

Trending now
This is a popular solution!

Step by step
Solved in 2 steps

Recommended textbooks for you
Glencoe Algebra 1, Student Edition, 9780079039897…
Algebra
ISBN:
9780079039897
Author:
Carter
Publisher:
McGraw Hill

Functions and Change: A Modeling Approach to Coll…
Algebra
ISBN:
9781337111348
Author:
Bruce Crauder, Benny Evans, Alan Noell
Publisher:
Cengage Learning
Glencoe Algebra 1, Student Edition, 9780079039897…
Algebra
ISBN:
9780079039897
Author:
Carter
Publisher:
McGraw Hill
Functions and Change: A Modeling Approach to Coll…
Algebra
ISBN:
9781337111348
Author:
Bruce Crauder, Benny Evans, Alan Noell
Publisher:
Cengage Learning