2 Again use the data from Table [ Fifty randomly-selected Durham burials (1960-1969) ] . (a) Calculate a Be sure to show how you found T and the margin of error. 90% confidence interval for the average age at burial during this period (b) Use your confidence interval from #2a to hypothesis test whether burial during this period was Hj and explain how you performed the hypothesis test. State your conclusion. the average age at 58 years. Indicate clearly what you used as Ho and as


Unitary Method
The word “unitary” comes from the word “unit”, which means a single and complete entity. In this method, we find the value of a unit product from the given number of products, and then we solve for the other number of products.
Speed, Time, and Distance
Imagine you and 3 of your friends are planning to go to the playground at 6 in the evening. Your house is one mile away from the playground and one of your friends named Jim must start at 5 pm to reach the playground by walk. The other two friends are 3 miles away.
Profit and Loss
The amount earned or lost on the sale of one or more items is referred to as the profit or loss on that item.
Units and Measurements
Measurements and comparisons are the foundation of science and engineering. We, therefore, need rules that tell us how things are measured and compared. For these measurements and comparisons, we perform certain experiments, and we will need the experiments to set up the devices.
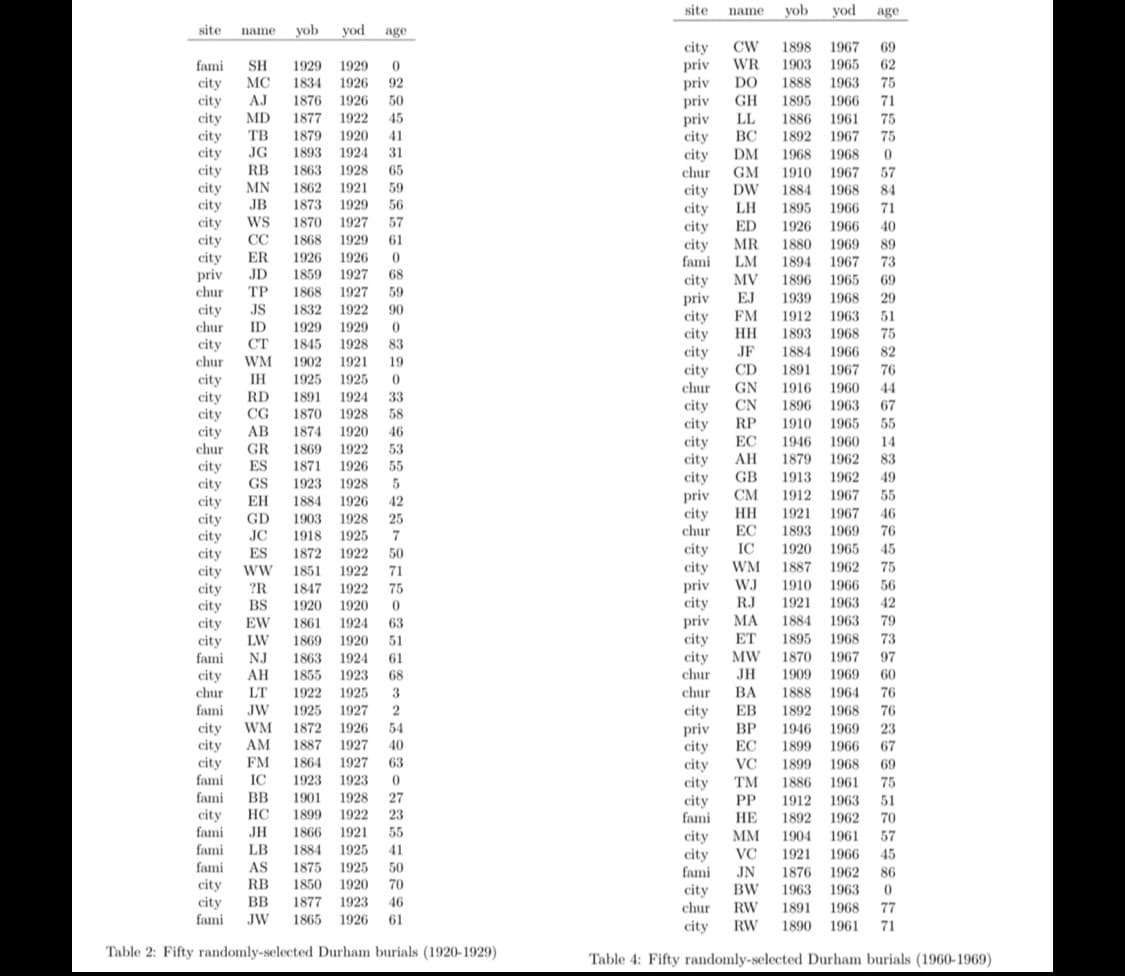
![Again use the data from Table
[ Fifty randomly-selected Durham burials
(1960-1969) ] .
(a) Calculate a
Be sure to show how you found T and the margin of error.
90% confidence interval for
the average age at burial during this period
(b) Use your confidence interval from #2a to hypothesis test whether
burial during this period was
H1 and explain how you performed the hypothesis test. State your conclusion.
the average age at
58 years. Indicate clearly what you used as Ho and as](/v2/_next/image?url=https%3A%2F%2Fcontent.bartleby.com%2Fqna-images%2Fquestion%2Ffe8fe871-3b6d-41db-acf7-a6e3f508b94d%2F907b4f31-d2ce-4dcf-a9e7-81ec8d48f5cf%2Fekh5fpo_processed.jpeg&w=3840&q=75)

Step by step
Solved in 2 steps


