2. Consider the following manual simulation of machine breakdowns and repair. Time between breakdowns, Repair time, у (days) Cost Breakdowns x (weeks) ($2,000 y) 1 4 $2000 $4000 1 2 5.7 3 5.5 2 $4000 $2000 $4000 $4000 4 2.5 1 5 6 5.2 5.8 7 1.6 1 $2000 2.3 1.2 3.3 $4000 $4000 8. 9 10 $4000 What operating characteristics can be obtained from this simulation? 22 2/22
2. Consider the following manual simulation of machine breakdowns and repair. Time between breakdowns, Repair time, у (days) Cost Breakdowns x (weeks) ($2,000 y) 1 4 $2000 $4000 1 2 5.7 3 5.5 2 $4000 $2000 $4000 $4000 4 2.5 1 5 6 5.2 5.8 7 1.6 1 $2000 2.3 1.2 3.3 $4000 $4000 8. 9 10 $4000 What operating characteristics can be obtained from this simulation? 22 2/22

MATLAB: An Introduction with Applications
6th Edition
ISBN:9781119256830
Author:Amos Gilat
Publisher:Amos Gilat
Chapter1: Starting With Matlab
Section: Chapter Questions
Problem 1P

Related questions
Question
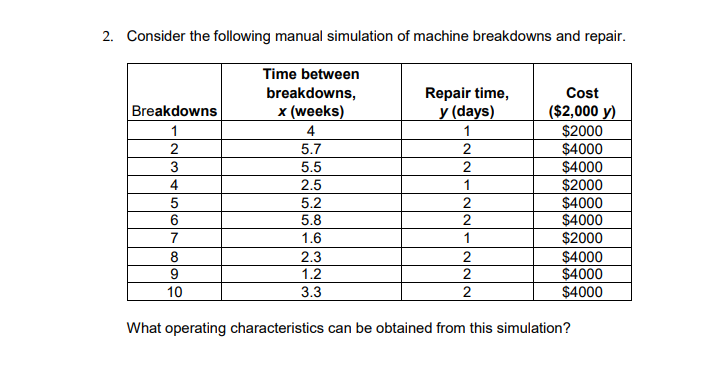
Transcribed Image Text:2. Consider the following manual simulation of machine breakdowns and repair.
Time between
breakdowns,
Repair time,
y (days)
Cost
Breakdowns
x (weeks)
($2,000 y)
1
4
$2000
$4000
1
2
5.7
3
5.5
$4000
$2000
4
2.5
1
5
5.2
$4000
$4000
$2000
5.8
7
1.6
8
2.3
$4000
$4000
$4000
9
1.2
10
3.3
What operating characteristics can be obtained from this simulation?
N/21222
Expert Solution
This question has been solved!
Explore an expertly crafted, step-by-step solution for a thorough understanding of key concepts.

This is a popular solution!

Trending now
This is a popular solution!

Step by step
Solved in 2 steps with 2 images

Recommended textbooks for you
MATLAB: An Introduction with Applications
Statistics
ISBN:
9781119256830
Author:
Amos Gilat
Publisher:
John Wiley & Sons Inc

Probability and Statistics for Engineering and th…
Statistics
ISBN:
9781305251809
Author:
Jay L. Devore
Publisher:
Cengage Learning

Statistics for The Behavioral Sciences (MindTap C…
Statistics
ISBN:
9781305504912
Author:
Frederick J Gravetter, Larry B. Wallnau
Publisher:
Cengage Learning
MATLAB: An Introduction with Applications
Statistics
ISBN:
9781119256830
Author:
Amos Gilat
Publisher:
John Wiley & Sons Inc
Probability and Statistics for Engineering and th…
Statistics
ISBN:
9781305251809
Author:
Jay L. Devore
Publisher:
Cengage Learning
Statistics for The Behavioral Sciences (MindTap C…
Statistics
ISBN:
9781305504912
Author:
Frederick J Gravetter, Larry B. Wallnau
Publisher:
Cengage Learning

Elementary Statistics: Picturing the World (7th E…
Statistics
ISBN:
9780134683416
Author:
Ron Larson, Betsy Farber
Publisher:
PEARSON

The Basic Practice of Statistics
Statistics
ISBN:
9781319042578
Author:
David S. Moore, William I. Notz, Michael A. Fligner
Publisher:
W. H. Freeman

Introduction to the Practice of Statistics
Statistics
ISBN:
9781319013387
Author:
David S. Moore, George P. McCabe, Bruce A. Craig
Publisher:
W. H. Freeman